Tag: Decision making

  • What Are the Best Fuelfinance Alternatives in 2026?

    What Are the Best Fuelfinance Alternatives in 2026?

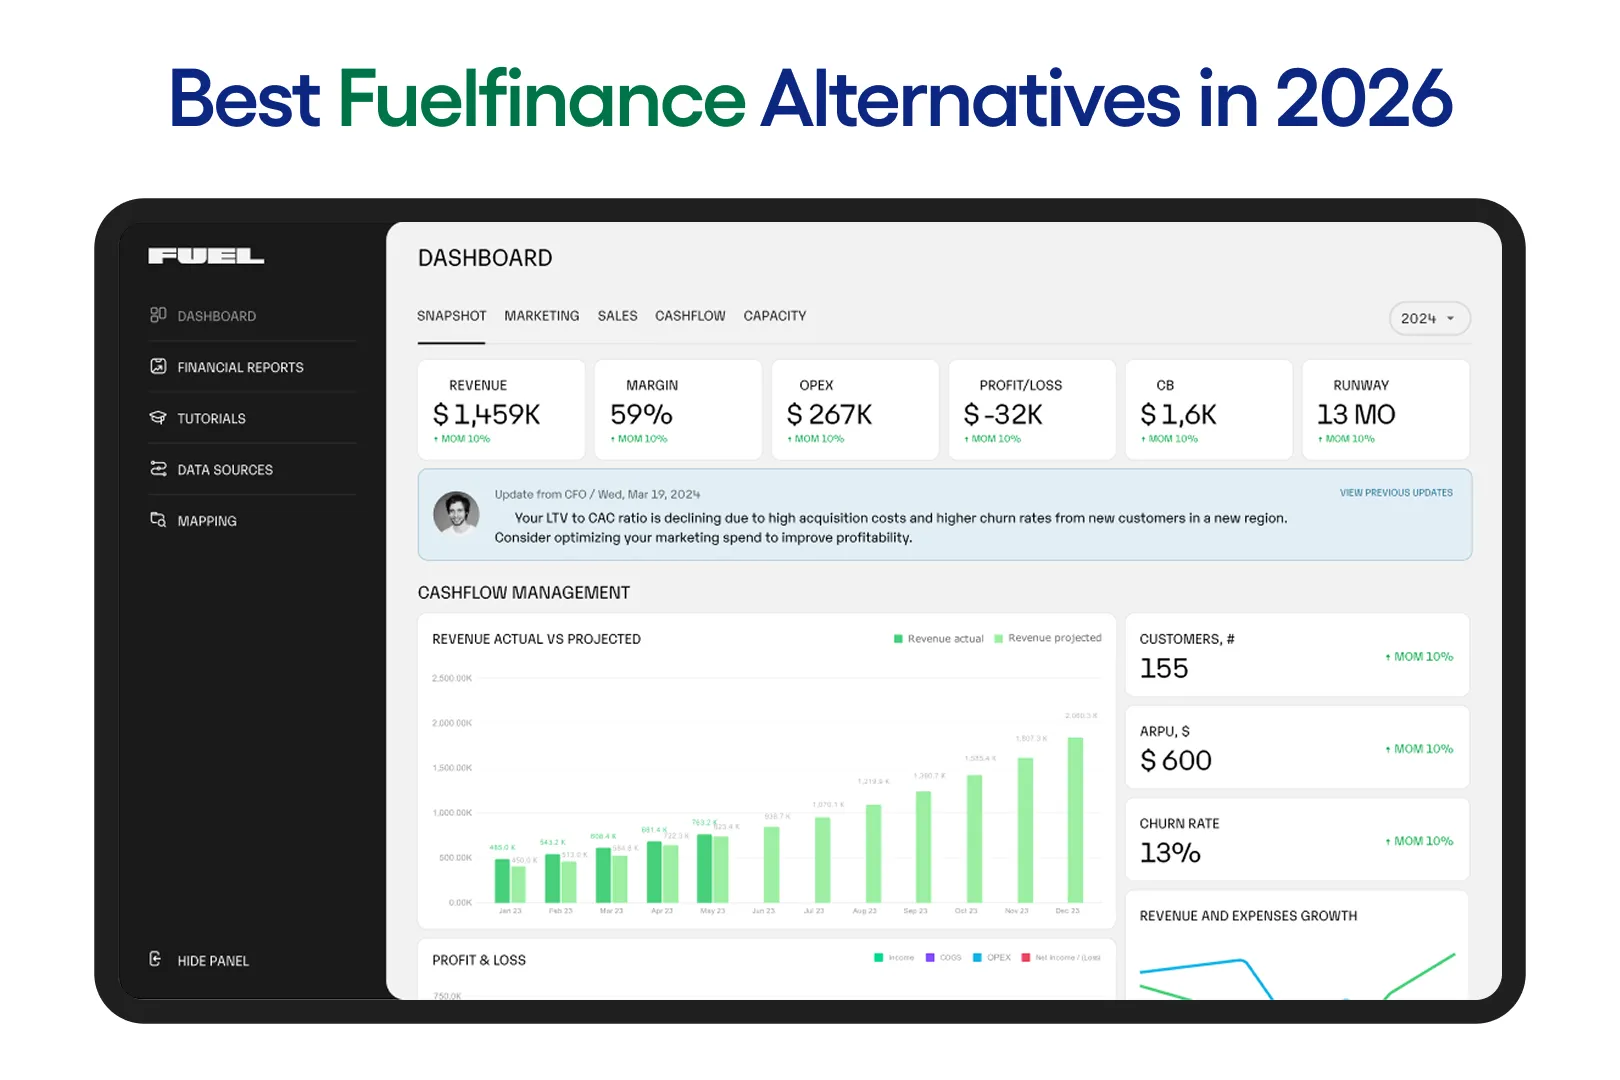
    Fuelfinance is a financial planning platform for startups and small businesses. It combines AI forecasting with a dedicated financial manager, which makes it useful for founders who need financial visibility without hiring a full-time CFO. That said, three clear reasons lead people to look elsewhere: the starting price of $1,199+ per month is a meaningful commitment for an early-stage business, the managed service model does not suit everyone who prefers self-serve financial planning and analytics (FP&A) software, and Fuelfinance is built specifically for digital businesses rather than physical ones.

    This page compares 7 Fuelfinance alternatives across those three reasons. These alternatives are for startups, agencies, and digital businesses looking for a different FP&A tool. One also caters to physical business owners like restaurants, salons, gyms, and retail shops, who need financial and operational data combined, which Fuelfinance is not built to deliver. Each alternative is reviewed on what it does, who it is best for, and what it does not do.

    For context: Fuelfinance is a cloud-based FP&A platform with AI forecasting, budget vs actual tracking, scenario planning, and a dedicated financial manager included in the subscription. Pricing is quote-based, but industry insights confirm it starts from $1,199 per month. It is built for startup founders and SMB owners without a finance background.

    Fuelfinance Alternatives, At A Glance

    Here is a quick summary before the full review of each alternative.

    ToolMain FocusHuman Team IncludedBest ForBiggest LimitationStarting Price
    MiivoPhysical business BIYes✅Physical businesses, Multi-location businessesNot an FP&A platformFrom $399/month
    Mosaic (now acquired by HiBob)AI FP&ANoSaaS and growth companies with finance teamEnterprise pricingCustom quote
    Pry (now Brex)Cash runway + FP&ANoPre-Series A startupsLimited depthFrom $12/user/month + add-on charges
    LiveFlowSpreadsheet syncNoFinance pros, accountantsSpreadsheet-dependentCustom quote, ranges from $200 – 1,500+/month
    Runway FinancialVisual cash modelingNoSeed-Series B startupsPricing opaquequote-based
    JiravMid-market FP&ANo$10M-$100M businessesComplex setupFrom $10,000/year
    FloatCash flow forecastingNoService businesses, agenciesCash focus onlyFrom $130/month

    Miivo: Business Intelligence Plus a Human Team, Built for Physical Businesses

    What Miivo Is

    Miivo is a business intelligence service with a dedicated human team for physical businesses. Like Fuelfinance, the BI tool combines software with a team that handles setup and interpretation. Unlike Fuelfinance, it connects operational data from the POS alongside financial data from accounting, which gives a physical business a complete daily view of what is actually happening across both sides of the operation.

    Best For

    Restaurant owners, salon groups, gym operators, and retail businesses who want financial and operational data combined automatically, with a human team handling setup and interpretation. No finance background required.

    What Miivo Does Well

    • Miivo joins financial data from accounting, POS data (covers, average spend, product performance), and customer review data into one automatic daily dashboard. 
    • AI Warning Signals flag when something changes before it shows up in your accounting software. 
    • Opportunity Cards surface specific actions with an estimated revenue impact. 
    • A dedicated human team handles all setup and maintenance. 
    • Live in 5 business days. 
    • Pricing is published and fixed.

    What Miivo Does Not Do

    Miivo is not an FP&A platform. It does not do scenario planning, forecasting, or startup runway modeling in the Fuelfinance sense. It is not ideal for SaaS companies, agencies, or digital businesses but is suitable if the business has a physical location.

    Pricing: Free Ready To Use with no credit card requirement, Built For You at $399/month. Managed Services at $1,299/month. Setup included.

    What Makes Miivo Stand Out?

    Every alternative on this list except Miivo is built mainly for digital businesses. If you run a restaurant, salon, gym, or retail shop, the tools below will not connect to your POS, will not show you covers or average spend, and will not tell you why a Tuesday in March performed differently from the one before it. Fuelfinance has the same limitation. The alternative built for physical businesses is Miivo.  

    See how Miivo works for physical businesses

    Mosaic: AI-Powered FP&A for SaaS and Growth-Stage Businesses

    What Mosaic Is

    Mosaic is an AI-powered FP&A platform built for SaaS and growth-stage businesses, now acquired by HiBob. It connects with accounting software (QuickBooks, NetSuite), CRM platforms (Salesforce, HubSpot), HRIS tools, and billing systems to build a unified financial model. The platform surfaces SaaS-specific metrics, like ARR (Annual Recurring Revenue), churn, CAC (Customer Acquisition Cost), and LTV (Customer Lifetime Value), automatically, without requiring manual data entry from your finance team.

    Best For

    SaaS companies and growth-stage startups with a finance team or CFO who want automated financial modeling and AI-powered anomaly detection. Works best for businesses in the $5M to $50M ARR range that have outgrown spreadsheets but do not yet need enterprise software.

    What Mosaic Does Well

    • Handles SaaS-specific financial metrics better than most FP&A tools. 
    • AI-powered insights and anomaly detection flag changes in real time. 
    • Headcount planning is built in, which matters for teams managing hiring against a financial model. 
    • The interface is modern and well-reviewed by finance leaders at growth-stage companies.

    What Mosaic Does Not Do

    Mosaic does not include a dedicated human financial manager. It is fully self-serve, which means that the finance team builds and maintains its own models. It is not built for physical businesses. Pricing sits in the enterprise range, which makes it a difficult fit for early-stage startups watching costs closely.

    Pricing: Custom pricing, not published. Typically $1,000 to $3,000+ per month for growth-stage companies. Demo required.

    Is Mosaic Worth It for an Early-Stage Startup?

    Not usually, as Mosaic is priced and designed for companies with a finance team already in place. If you are pre-Series A without a dedicated CFO or financial analyst, you need more practical starting points.

    Pry (Now Brex): Cash Runway and FP&A for Early-Stage Startups

    What Pry Is

    Pry is a financial planning platform for early-stage startups, now part of Brex. It covers budget vs actual tracking, cash runway, hiring plan modeling, and scenario planning. The platform integrates with QuickBooks, Xero, Gusto, and Brex spend management. The tool is designed for founders who need financial visibility without a dedicated finance person.

    Best For

    Pre-revenue to Series A startups and early-stage founders who need to track cash runway, manage headcount forecasting, and run basic scenario planning. Works well as a first step beyond spreadsheets for teams without a full-time finance hire.

    What Pry Does Well

    • Budget vs actual tracking updates automatically with bank sync. 
    • Cash runway projections are visual and easy to read. 
    • The hiring plan tracks headcount and fully loaded employee costs, which is useful when modeling the impact of new hires on runway. 
    • Scenario planning is accessible. 
    • Pricing is significantly lower than Fuelfinance.

    What Pry Does Not Do

    Pry does not include a dedicated human financial manager. it is self-serve. The depth of financial modeling is lighter than Fuelfinance or Mosaic, which makes it better suited to simpler business models. Physical business data (POS, bookings, operational metrics) is not supported.

    Pricing: Free plan available as Essesntials. Paid Premium plan starts from $12/user/month, while Enterprise plan is custom.

    Pry vs Fuelfinance: What Changes?

    The main trade-off is human support vs cost. Fuelfinance includes a dedicated financial manager, Pry does not. If the fractional CFO model is what you need, Pry will not replace it. If you want a self-serve tool at a lower price point, Pry covers the core FP&A functions for early-stage businesses.

    LiveFlow: FP&A That Stays Inside Google Sheets and Excel

    What LiveFlow Is

    LiveFlow is a Google Sheets and Excel-based FP&A tool that automatically syncs accounting data from QuickBooks, Xero, and NetSuite into existing spreadsheet models. It removes the manual copy-paste step between accounting software and your financial models, which keeps spreadsheets live without rebuilding them.

    Best For

    Finance professionals and accountants who work mostly in Google Sheets or Excel and want to keep that workflow while automating data sync from accounting software. Also works well for agencies and advisory firms that manage multiple clients from a single spreadsheet setup.

    What LiveFlow Does Well

    • LiveFlow stays inside Google Sheets and Excel. 
    • There is no new interface to learn. 
    • Automatic data sync removes the manual update cycle from financial reporting. 
    • Multi-client management makes it practical for accounting firms and agencies that run consolidated reporting across several entities. 

    What LiveFlow Does Not Do

    LiveFlow requires comfort with spreadsheets. It is not a dashboard-first product and does not suit users who want a purpose-built FP&A interface. There is no dedicated human financial manager too. Physical business data is not supported.

    Pricing: Custom pricing, after booking demo. According to industry data pricing typically starts from $200 to $1,500+ per month for enterprise level.

    Who Should Not Use LiveFlow?

    Anyone who wants to move away from spreadsheets entirely. LiveFlow is a tool that helps with the spreadsheet workflow; it does not replace it. If the reason you are looking for a Fuelfinance alternative is that your current process is too spreadsheet-heavy, LiveFlow will not solve that.

    Runway Financial: Visual Cash Flow Modeling for Startup Founders

    What Runway Financial Is

    Runway Financial is a financial planning and scenario modeling platform with a strong visual interface. It connects with QuickBooks, Stripe, Gusto, and other common startup tools to build a financial model that displays as a timeline instead of a spreadsheet. The platform focuses on cash flow modeling, hiring plans, and scenario planning for growth-stage businesses.

    Best For

    Seed to Series B startups and growth companies that want visual cash flow modeling and scenario planning with a modern interface. Suitable for founders who prefer to see their financial model as a timeline and want AI-powered insights built into that view.

    What Runway Financial Does Well

    • The visual interface makes complex financial models accessible to founders without a finance background. 
    • Scenario planning updates in real time across dashboards. 
    • Integrations with common startup tools (Stripe, Gusto, QuickBooks) work well for digital businesses with a standard stack. 
    • AI-powered insights surface anomalies automatically.

    What Runway Financial Does Not Do

    Runway Financial does not include a dedicated human financial manager and is self-serve. Depth of financial modeling is less than enterprise-grade FP&A tools. Pricing is not published, which makes it harder to evaluate without going through a demo.

    Pricing: Custom. Demo required. Estimated mid-hundreds per month for startups.

    Is Runway Financial the Right Fit for Your Stage and Budget?

    Runway Financial works well when your main job is modeling growth for investors. It does not fit as smoothly when you run a local business that needs daily operational insights instead of funding scenarios.

    Jirav: FP&A for Mid-Market and Professional Services Businesses

    What Jirav Is

    Jirav is an FP&A platform for mid-market and professional services companies. The finance tool combines financial and operational data, supports headcount planning, multi-entity consolidation, and board reporting. The platform integrates with NetSuite, QuickBooks, Salesforce, and other platforms used by businesses in the $10M to $100M revenue range.

    Best For

    Professional services firms, agencies, and mid-market companies that need multi-entity financial consolidation and operational data combined with financial planning. Works best for businesses that have outgrown early-stage tools and need board-ready reporting across multiple departments or legal entities.

    What Jirav Does Well

    • Multi-entity consolidation is Jirav’s biggest selling point for businesses with complex legal structures or multiple departments. 
    • Operational and financial data are modeled together. 
    • Headcount planning is built in and detailed. 
    • Board-ready reporting templates reduce the time spent formatting financial presentations.

    What Jirav Does Not Do

    Jirav is more complex and more expensive than early-stage tools. It typically requires onboarding support to set up correctly. There is no dedicated ongoing human financial manager. Physical business operational data is not natively supported.

    Pricing: Custom. Not published. Typically starts from $10,000+ annually.

    What’s Different Between Jirav and Fuelfinance?

    Fuelfinance is designed for founders without a finance background who need their first layer of financial visibility. Jirav is designed for businesses that already have a finance function and need to manage more complex reporting. The two tools serve different stages of the same growth path.

    Float: Cash Flow Forecasting, and Nothing Else

    What Float Is

    Float is a cash flow forecasting tool that connects directly with QuickBooks, Xero, and FreeAgent to build an automated cash flow forecast. Its single focus is showing how much cash the business will have and when. The tool does not attempt to be a full FP&A platform.

    Best For

    Service businesses, agencies, and small businesses that need to forecast their cash position week by week, manage client payment timing, and avoid cash flow surprises. Works well as a focused add-on alongside an accounting tool for businesses that do not need scenario planning or headcount modeling.

    What Float Does Well

    • Float builds an automatic cash flow forecast directly from accounting data. 
    • Scenario modeling for cash is practical: it shows what happens if a client pays late, if a large invoice lands early, or if a recurring cost increases. 
    • The interface is visual and easy to read. 
    • Pricing is affordable compared to full FP&A platforms.

    What Float Does Not Do

    Float is a cash flow forecasting tool only, it does not do P&L planning, headcount modeling, or scenario planning beyond cash. There is no human advisor included. Physical business operational data is not supported.

    Pricing: Pricing available in GBP, USD, AUD, and EUR. Starter Essentials plan costs $130/month. Growth plan costs $265/month, while Scale plan starts from $389/month. Annual discounts available.

    Is Float the Right Cash Flow Tool for Your Business?

    Float earns its place on this list for one specific situation: a service business or agency that invoices on net terms, manages irregular payment timing, and needs to know every day whether cash is going to be tight in the next few weeks. For that job, it is fast to set up, affordable, and genuinely useful. The moment the need expands to P&L planning, headcount modeling, or investor reporting, Float stops being enough. It is not a weakness of the tool, it is the product’s design.

    Which Fuelfinance Alternative Is Right for Your Situation?

    The following common situations clearly point to the need for specific tools.

    1. You are an early-stage startup founder who needs to track runway and plan headcount without hiring a finance person: Pry is the most accessible starting point, as it is affordable, integrates with QuickBooks and Xero, and covers the basics: budget vs actual, cash runway, and hiring plan modeling.
    2. You run a SaaS business with a finance team and need AI-powered financial modeling: Mosaic is the strongest option because it is built specifically for SaaS metrics and growth-stage financial planning, with good integrations across CRM, HRIS, and billing platforms.
    3. You work in Google Sheets or Excel and want to stop updating your models manually: LiveFlow is built for exactly this to keep your existing spreadsheet workflow while automating the data sync from accounting software. It removes the manual step without changing how you work.
    4. You need focused cash flow forecasting and not a full FP&A platform: Float is the most specialized option for this. It is simple, affordable, and does one thing well: showing how much cash the business will have and when.
    5. You run a physical business, such as a restaurant, salon, gym, or retail shop, and need financial and operational data combined automatically: Miivo is the only option on this list built for physical businesses. The Fuelfinance alternative connects POS data alongside financial data and includes a dedicated human team, without you requiring a finance background or technical setup.

    Running a Physical Business and Looking for a Fuelfinance Alternative?

    Book a 15-minute call and Miivo will connect to your data and show you what your financial and operational picture looks like inside the platform.

    [Book a 15-minute call]

    *No credit card. No commitment. See your data first.
  • How Do You Track Budget vs Actual Performance in Your Business?

    How Do You Track Budget vs Actual Performance in Your Business?

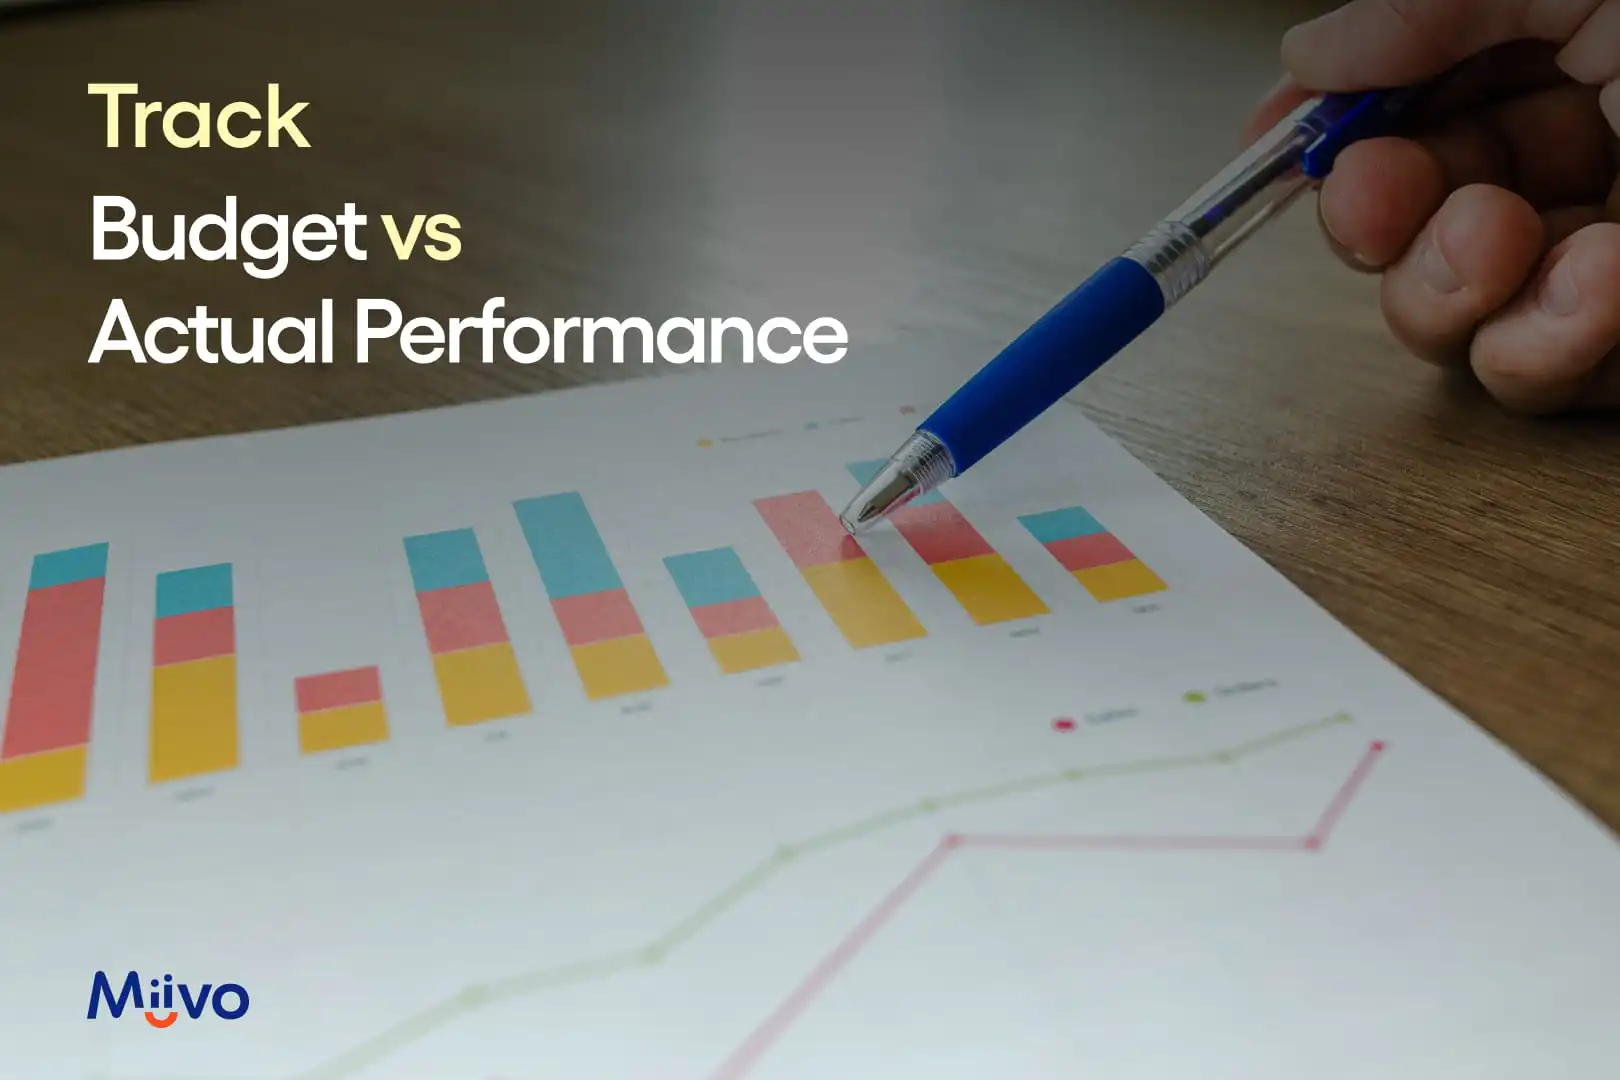
    Most businesses set a budget at the start of the year, but very few actually use it. By the end of January it is sitting untouched while decisions are made based on the bank balance and a rough sense of how things are going. A budget only becomes useful when you compare it to what actually happened. That comparison, done regularly, turns a budget from a planning document into a tool that tells you when something needs to change.

    What Is Budget vs Actual Analysis and Why Does It Matter?

    Budget vs actual analysis is the practice of comparing what you planned to happen financially with what actually happened, then examining the variance to understand what is going on and what to do about it. A budget without this comparison is just a guess made at the start of the year. A budget with regular comparison becomes a measurement system that tells you when costs are drifting, when revenue is underperforming, and when you need to act before a problem grows. According to Rae & Associates, the days of setting a budget in January and checking it in December are over. In 2026, costs are shifting, markets are changing, and cash flow is tightening. It is time to actually turn financials into a decision-making tool.

    What Should a Small Business Include in a Budget vs Actual Comparison?

    A budget vs actual comparison covers more than just revenue and expenses. For a physical business, it has two layers.

    Financial budget vs actual

    Track revenue against target, cost of goods sold as a percentage of revenue, gross margin, operating expenses by category, and net profit. These figures come from the profit and loss statement in your accounting software. One important note: your budget categories must match your accounting categories exactly. If they do not align, the comparison will not produce meaningful results.

    Operational budget vs actual (for physical businesses)

    For a restaurant, operational budget vs actual comparison includes covers served against a target, table turnover rate, average spend per cover, and food cost percentage against a planned figure. For a salon, it includes appointment fill rate, rebooking rate, and revenue per treatment hour. For a gym, it includes class fill rate and membership retention against plan. These operational numbers explain why the financial numbers look the way they do.

    Covering budget vs actual for physical businesses and stopping at the P&L only gives half the picture. A restaurant can hit its revenue target while running unsustainable food cost and labor variances underneath it. Without operational data alongside financial data, the variance report cannot tell you why the numbers moved.

    How Do You Calculate and Interpret a Budget Variance?

    The calculation is straightforward. Variance equals actual minus budget; a positive number means actual was higher than budget. Whether that result is favorable depends on whether the line is revenue or cost.

    Line ItemBudgetActualVarianceLabel
    Revenue$80,000$74,000-$6,000Unfavourable; revenue came in below plan
    Food cost$22,000$19,500-$2,500Favourable; cost was lower than planned
    Labor$18,000$21,000+$3,000Unfavourable; labor ran over plan

    A positive variance is not always good news, and a negative one is not always bad. Investigate both, as a revenue variance below budget needs a reason, so does one that is significantly above it. As CFO Share notes, “The value is not in printing the report. It is in interpreting it.”

    How Often Should a Small Business Review Budget vs Actual?

    Financial budget vs actual should be reviewed monthly, once accounts are reconciled for the previous month. This is the minimum cadence to catch a drifting cost or a revenue gap while there is still time to act. For a physical business, operational metrics need an even shorter review loop. A restaurant owner who checks covers against target only at month-end is finding out too late to change anything. A weekly operational review, at minimum, and a daily view of covers and revenue against the week’s target is the standard for any business where daily performance varies significantly. Some businesses also use a rolling forecast besides the static budget to adjust expectations mid-period when conditions shift materially.

    What Are the Most Common Budget vs Actual Tracking Mistakes Small Businesses Make?

    Most small businesses make the same few mistakes when tracking variances.

    • Setting the budget and never looking at it again: A budget reviewed once a year is not a management tool, it is a document. Monthly comparison is the minimum for it to have any practical value.
    • Only tracking revenue and ignoring cost variances: An unfavorable cost variance can offset a favorable revenue one completely. Tracking only the top line gives half the picture.
    • Treating every variance the same: A small variance that is growing month over month is more dangerous than a large one-off variance. Direction and trend matter as much as the absolute number.
    • Not acting after finding a variance: The value is not in the report; it is in what the report prompts. A variance without a follow-up question and a corrective action is just wasted analysis.

    How Do Physical Businesses Track Budget vs Actual Across Financial and Operational Data?

    The challenge for a small physical business is that financial budget vs actual comes from the accounting software, and operational budget vs actual comes from the POS, the bookings system, and the review platforms. Pulling both together manually every week is time-consuming enough that most owners give up and go back to checking the bank balance. Miivo’s AI Business Dashboard connects the financial data from accounting and the operational data from the POS automatically, flagging when either is moving outside its planned range without the owner having to pull the numbers themselves.

    Which KPIs Should a Small Business Track Against Its Budget?

    A small business’s KPIs to track against its budget include budget variance, net profit margin, operating cash flow, and customer acquisition cost. A small business must carefully cover the KPIs that matter most for its type and prioritize them in its review process. 

    What is the difference between budget vs actual and a forecast?

    A budget is set once, typically at the start of a financial year, and reflects your original plan. A forecast is updated regularly to reflect current expectations based on actual results to date. Budget vs actual compares performance against the original plan. A rolling forecast adjusts the target as conditions change.

    What Does a Business Dashboard Show for Budget vs Actual Tracking?

    The most practical way to review budget vs actual regularly is in a dashboard that updates automatically. A business dashboard brings data from all the sources, including accounting, POS, and CRM, and compares them to track preset budget vs actual results.

    Can a small business track budget vs actual without an accountant?

    Yes, the core calculation, actual minus budget, requires only that your accounting categories match your budget categories. The more common barrier is consistency. Most small business owners start the process and stop when it becomes manual and time-consuming.

    How do operational metrics connect to financial variances?

    Operational metrics explain the cause behind financial variances. A food cost percentage running above budget is a financial variance. The reason may be a supplier price increase, a portion control issue, or waste. None of those causes appear in the P&L, they appear in operational data.

    What is the minimum setup needed to start budget vs actual tracking?

    The minimum setup needed to start budget vs actual tracking includes a written budget broken down by month and by category, accounting records kept in categories that match the budget, and a scheduled monthly review. Start with financial figures. Add operational metrics once the financial comparison is running consistently.

    Frequently Asks Questions

    Which KPIs should a small business track against its budget?

    A small business’s KPIs to track against its budget include budget variance, net profit margin, operating cash flow, and customer acquisition cost. A small business should prioritize the KPIs that matter most for its type in its review process.

    What is the difference between budget vs actual and a forecast?

    A budget is set once, typically at the start of a financial year, and reflects your original plan. A forecast is updated regularly to reflect current expectations based on actual results to date. Budget vs actual compares performance against the original plan. A rolling forecast adjusts the target as conditions change.

    Can a small business track budget vs actual without an accountant?

    Yes, the core calculation, actual minus budget, requires only that your accounting categories match your budget categories. The more common barrier is consistency. Most small business owners start the process and stop when it becomes manual and time-consuming.

    How do operational metrics connect to financial variances?

    Operational metrics explain the cause behind financial variances. A food cost percentage running above budget is a financial variance. The reason may be a supplier price increase, a portion control issue, or waste. None of those causes appear in the P&L, they appear in operational data.

    What is the minimum setup needed to start budget vs actual tracking?

    The minimum setup needed to start budget vs actual tracking includes a written budget broken down by month and by category, accounting records kept in categories that match the budget, and a scheduled monthly review. Start with financial figures, then add operational metrics once the financial comparison is running consistently.

  • Gut Feeling vs. Data-Driven Decisions: Why It Changes and How to Combine Both

    Gut Feeling vs. Data-Driven Decisions: Why It Changes and How to Combine Both

    Gut feelings can be reliable when a business is small and the owner sees every interaction, but as a business grows, cognitive biases begin to distort these instincts. Combining intuition with data creates a reliable process where your gut notices a pattern, data verifies it, and your judgment makes the final decision.

    Research suggests over half of businesses base at least half of their regular business decisions on gut feel or experience rather than data. Early on, that usually works fine. As a business grows, it gets harder. This article looks at why that shift happens, what changes when data joins the decision, and how to start, without throwing out the instincts that got you here in the first place.

    What does ‘gut feeling’ actually mean in business?

    When a business owner makes a decision based on gut feeling, they are not guessing randomly. They are drawing on everything they have noticed before, such as which days tend to be busy, which customers tend to come back, and which suppliers tend to cause problems. The pattern recognition is real and often accurate. The issue is not that gut feeling is wrong, but the fact that it depends completely on what the owner has personally seen, and there is a limit to how much of the business one person can personally see at once.

    Why does gut feeling work well in the early days?

    When a small salon has 40 regular clients, the owner knows most of them by name, knows who is happy and who has been quiet lately, and can feel a shift in the business almost as it happens. Decisions made on instinct at this early stage are often right, because the owner’s gut is built directly from daily, personal contact with the whole customer base. There is no meaningful gap between what is actually happening on the floor and what the owner can clearly see. Speed matters much more than deep analysis when the picture is this small and this close.

    Why does gut feeling become less reliable as a business grows?

    As a business grows past the point where the owner can personally know everyone, the same instincts that used to work start to quietly mislead. The following patterns show up again and again.

    PatternWhat It Sounds LikeWhat Actually Happens
    Selection bias“My regulars would tell me if something was wrong”The regulars who complain are the ones you hear from. The quiet customers who simply stop booking never say anything, they just do not come back.
    Recency bias“This week has been terrible, something is seriously wrong”One bad weekend feels like a trend, even if the three weeks before it were completely normal.
    Confirmation bias“I always said the new till system would slow things down, and now it has”Once you expect something to be the cause, you notice the days that confirm it and overlook the days that do not. A survey by the Economist Intelligence Unit found that 57 percent of senior business professionals would reanalyze data if it contradicted their gut feeling.

    None of these mean the owner is bad at running the business. They are normal patterns that affect everyone, and they get stronger as the business gets bigger.

    What does a data-driven decision actually look like?

    A data-driven decision starts the same way a gut decision does: you notice something. But here’s the difference, instead of acting on the feeling immediately, you check it against what the numbers actually show. If a salon owner senses that Tuesdays have gone quiet, a data-driven approach means looking at bookings for the last few Tuesdays before deciding whether to change staffing, run a promotion, or do nothing. Research from McKinsey has linked this kind of data-informed decision-making to meaningfully higher profitability, with some analyses showing earnings improvements of up to 25% in organizations that consistently do this.

    What is the difference between a gut decision and a data-informed one, in practice?

    Here is the same situation handled two ways: a cafe deciding whether to raise its coffee prices.

    Gut ApproachData-Informed Approach
    The owner feels customers will accept a price rise, since nearby cafes charge more.The owner checks how often regulars currently visit and roughly how price-sensitive this customer base has been in the past, based on how they reacted to past small changes.
    Prices go up across the board immediately.Prices go up on a couple of items first, while keeping an eye on whether regulars visit less often over the following two to three weeks.
    If regulars start visiting less, it is hard to tell whether it was the price change or something else like weather or a new competitor.If visits drop noticeably after the change and nothing else has shifted, the cause is much clearer, and prices can be adjusted with more confidence.

    None of the approaches remove the owner’s judgment. The data-informed version just gives that judgment something to check itself against, so a price rise that does not land can be caught and corrected in weeks instead of being discovered in next quarter’s accounts.

    Does becoming data-driven mean ignoring your instincts?

    No, becoming data-driven does not mean ignoring your instincts. In practice, most owners who use data well describe a pattern that looks like gut, data, gut. The instinct notices something first, data checks if that instinct holds up, and then judgment decides what to do with what the data shows. Data on its own does not make decisions. It gives the instinct something to check itself against.

    This is not a soft compromise, it is how most experienced business owners actually work. Surveys of business leaders consistently find that the large majority believe human judgment should come before, not instead of, hard analysis. The aim of using more data is not to replace the instincts that built the business. It is to catch the moments when those instincts are about to be wrong, before they cost something.

    What usually gets in the way of using data?

    The most common reason owners give for not using data more is a lack of time. Pulling numbers together by hand, from a till, a booking system, and a bank account, genuinely takes hours that most owners do not have to spare. This is a real obstacle, not an excuse, and it is the first thing worth solving.

    The second is not feeling confident in interpreting what the numbers mean. An owner does not need to become a data analyst. They need the numbers explained in the same plain language they already use to talk about their business, so a number that has moved is obviously meaningful, just another figure on a screen.

    How can a small business start making more data-informed decisions?

    The easiest place to start is not to become data-driven as a whole, but to take one recurring decision, for example staffing levels, a pricing question, or which days to run promotions. Pick one, and for a few weeks, before acting on instinct, take a minute to check what the numbers say about that specific question.

    Once that single habit feels normal, rather than like extra work, it is likely to spread naturally to other decisions. The numbers or KPIs that are actually worth checking for most physical businesses are a small, fairly consistent set of data.

    What changes once the data starts flagging things for you?

    Making data-driven decisions is a habit that depends on remembering to check. A more proactive version flips this, where instead of the owner checking the numbers, the numbers tell the owner when something is different from normal. A quiet week, a cost that has crept up, a pattern in reviews, these get flagged automatically, and the owner’s judgment takes over from there, the same gut, data, gut pattern, just starting from a flag instead of a feeling.

    Miivo’s AI Business Dashboard works this way for small businesses. It flags Warning Signals when something moves outside its normal range, and surfaces specific Opportunity Cards when the data points to one. The data does not decide what to do. It makes sure the owner’s judgment gets applied to the right thing, at the right time, instead of discovering it weeks later.

    Where can a small business go next to put this into practice?

    Two practical questions usually follow from here. The first is which numbers actually matter for a business like yours, including how many to track and which ones tend to be vanity metrics. The second is what it looks like to see all of this in one place

    Miivo answers both of these questions at the same time. The business intelligence platform helps all types of small businesses put their regular data into practice through a single dashboard. The AI-powered technology continuously analyzes your data to help you make informed, data-driven decisions.

    What other questions do people ask about gut feeling and data?

    Can data ever be wrong or misleading?

    Yes, sometimes data can be incomplete, miscategorized, or measuring the wrong thing, and confident numbers can be just as misleading as a confident feeling. The correct approach is not to distrust data generally, it is the same fix as for gut feeling, which is to check it against something else before acting on it fully, whether that is a second data source or your own experience of the business.

    Is this different from just looking at more reports?

    Yes, this is different from just looking at more reports. A report is something you read after the fact. Using data in decisions means checking a specific number before you act on a specific decision, which is a habit, not a document. A business can produce plenty of reports that nobody reads before deciding anything, and a business can make genuinely data-informed decisions while glancing at very few numbers, as long as they are the right ones at the right moment.

    Does this apply if I am running the business on my own?

    Yes, arguably more so, as a solo owner has the least spare time to dig through numbers, which makes the ‘gut, data, gut’ habit even more valuable. Do a quick check on one number before a decision, rather than a full review of everything. The goal is not a bigger workload, it is a slightly different one, spent on the decisions that matter most.

    How long does it take to notice a difference?

    It depends on the decision, but the habit itself can start immediately. The next time you notice something and feel like acting on it right away, that is the moment to check. Whether the difference shows up in days or months depends on how often that kind of decision comes up. For something like weekly staffing, you would expect to see a pattern within a few weeks. Most business owners check metrics weekly.

    Frequently Asked Questions

    Can data ever be wrong or misleading?

    Yes, sometimes data can be incomplete, miscategorized, or measuring the wrong thing, and confident numbers can be just as misleading as a confident feeling. The correct approach is not to distrust data generally, it is the same fix as for gut feeling, which is to check it against something else before acting on it fully, whether that is a second data source or your own experience of the business.

    Is this different from just looking at more reports?

    Yes, this is different from just looking at more reports. A report is something you read after the fact. Using data in decisions means checking a specific number before you act on a specific decision, which is a habit, not a document. A business can produce plenty of reports that nobody reads before deciding anything, and a business can make genuinely data-informed decisions while glancing at very few numbers, as long as they are the right ones at the right moment.

    Does this apply if I am running the business on my own?

    Yes, arguably more so, as a solo owner has the least spare time to dig through numbers, which makes the ‘gut, data, gut’ habit even more valuable. Do a quick check on one number before a decision, rather than a full review of everything. The goal is not a bigger workload, it is a slightly different one, spent on the decisions that matter most.

    How long does it take to notice a difference?

    It depends on the decision, but the habit itself can start immediately. The next time you notice something and feel like acting on it right away, that is the moment to check. For something like weekly staffing, you would expect to see a pattern within a few weeks. Most business owners check metrics weekly.

  • How to Make Faster Business Decisions Without Hiring a CFO

    Introduction: The CFO Affordability Crisis

    You need financial expertise to make smart growth decisions. Fortunately, there are business decision making tools that can help guide you even if hiring a CFO costs $150,000-$300,000+ annually more than many small business owners can justify.

    What’s the alternative? Fly blind and hope your instincts work out?

    According to McKinsey’s SME Growth Report 2024, businesses making strategic decisions based on financial data grow 3.2x faster than those relying on intuition alone. Yet most SMEs don’t have access to CFO-level financial expertise.

    The gap between “knowing you need data-driven decisions” and “having the means to get expert financial guidance” has created an opportunity for AI-powered business advisors.

    In this guide, we’ll explore how modern SMEs are making faster, better business decisions without the CFO price tag and how you can too.

    Why CFO-Level Guidance Matters (But Hiring a CFO Doesn’t Make Sense)

    The Decision Speed Problem

    Your business faces constant choices:

    • Should we hire that sales person now or wait until Q2?
    • Do we expand to a new location?
    • Should we increase marketing spend by 30%?
    • Is this new product line actually profitable?
    • Should we take on venture capital or bootstrap?

    Without financial context, these are pure guesses. With financial context, they become calculated decisions.

    The best CFOs don’t just report what happened—they connect financial data to business outcomes, offering probabilistic guidance:

    “Based on our cash position ($150K), runway (8 months), and customer acquisition cost ($450), we can safely hire one sales person now and another in Q2. This maintains 6-month cash runway while accelerating growth.”

    That kind of clarity is worth its weight in gold. But it requires someone who:

    1. Understands your specific numbers
    2. Has context about your industry benchmarks
    3. Can model scenarios and understand trade-offs
    4. Can explain recommendations in business terms (not accounting jargon)

    The Cost Barrier

    Full-time CFO: $150K-$300K+ annually
    Fractional CFO (part-time): $5,000-$15,000/month ($60K-$180K/year)
    Big Four advisory: $300-$500/hour+

    For most SMEs, this is unaffordable. Especially when the business might not need 40 hours/week of CFO time—maybe 5-10 hours/week would suffice.

    The Solution Gap

    What SMEs actually need:

    • Real-time financial visibility (not month-end reports)
    • Quick answers to specific questions (not lengthy consulting engagements)
    • Scenario modeling (what if we raised prices 5%? hired 2 people?)
    • Actionable recommendations (not just analysis)
    • Affordable access to this guidance

    This is where AI-powered business advisors like Miivo step in.

    How AI Advisors Deliver CFO-Level Insights in 60 Seconds

    The Traditional CFO Workflow

    1. Request: You ask the CFO a question
    2. Data gathering: CFO pulls data from multiple systems (5-15 minutes)
    3. Analysis: CFO analyzes and models scenarios (30-120 minutes)
    4. Interpretation: CFO explains findings and recommendations (15-30 minutes)
    5. Decision: You make decision (could take days due to CFO availability)

    Total time: 1-4 hours per decision (spread across multiple days or weeks)

    The AI Advisor Workflow

    1. Question: You ask via chat/app
    2. Instant analysis: AI already has your data integrated, runs analysis in seconds
    3. Explanation: AI provides findings in plain English with recommendations
    4. Decision: You decide immediately

    Total time: 60 seconds to 5 minutes per decision

    What This Enables

    • Faster iteration: Instead of quarterly strategic reviews, you can test decisions weekly.
    • Better calibration: You see impact of decisions faster, course-correct more quickly.
    • Higher confidence: Data-driven decisions reduce decision paralysis and second-guessing.
    • Continuous optimization: Small improvements compound into significant results over time.

    Real-World Example: How a $5M SaaS Company Made Better Decisions Faster

    The Situation:
    Mike’s SaaS company had $5M ARR but was growing only 8% quarter-over-quarter. It should be growing 20%+. He had several theories about what to fix:

    • Hire more salespeople?
    • Increase marketing spend?
    • Improve product-market fit?
    • Lower churn?

    Without a CFO to analyze unit economics, he couldn’t tell which would have the biggest impact.

    The Old Way:
    Mike would have hired a fractional CFO ($10K/month) for 3 months to analyze the situation ($30K total). The analysis would take weeks and might recommend sales hiring (but Mike’s gut said marketing was the issue).

    With AI Advisor (Miivo):
    Mike connected his systems and asked: “What’s our unit economics breakdown, and which lever has the biggest impact on growth?”

    Instant answer:

    • Customer Acquisition Cost (CAC): $1,200
    • Lifetime Value (LTV): $6,000 (LTV:CAC ratio 5:1, healthy)
    • Growth bottleneck: Churn spiking at 8% monthly (vs. 4% industry average)
    • Recommendation: Focus on retention before acquiring new customers. Hire customer success, reduce churn to 5%. This alone would improve growth from 8% to 14% without additional marketing spend.

    Impact: Mike hired one customer success person (+$60K/year cost) and reduced churn to 5% within 90 days. Net result: Growth accelerated to 15%, and LTV:CAC improved from 5:1 to 7.5:1.

    ROI: Mike saved $30K in consulting fees, avoided expensive hiring mistakes, and generated $500K+ in additional ARR.

    7 Key Business Decisions AI Advisors Help You Make Faster

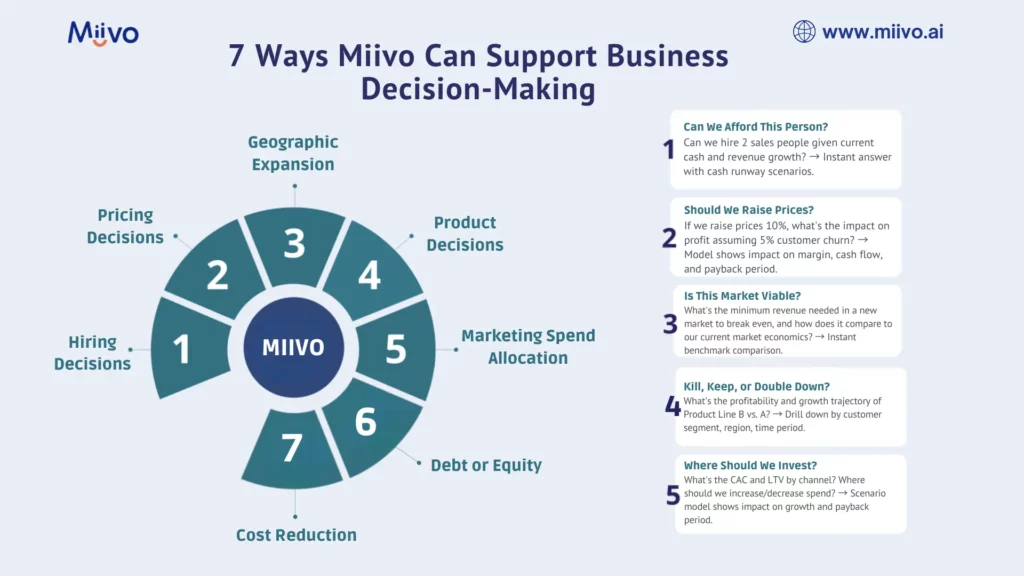
    1. Hiring Decisions: Can We Afford This Person?

    Old way: Guess based on feeling, or ask your accountant for a job cost analysis (takes 5-10 days).
    AI way: “Can we hire 2 sales people given current cash and revenue growth?” → Instant answer with cash runway scenarios.

    2. Pricing Decisions: Should We Raise Prices?

    Old way: Research competitors, gut feel, maybe a CFO analysis of margin impact.
    AI way: “If we raise prices 10%, what’s the impact on profit assuming 5% customer churn?” → Model shows impact on margin, cash flow, and payback period.

    3. Geographic Expansion: Is This Market Viable?

    Old way: Lengthy market analysis, risk assessment discussions.
    AI way: “What’s the minimum revenue needed in a new market to break even, and how does it compare to our current market economics?” → Instant benchmark comparison.

    4. Product Decisions: Kill, Keep, or Double Down?

    Old way: Product review meetings, margin analysis, guesswork.
    AI way: “What’s the profitability and growth trajectory of Product Line B vs. A?” → Drill down by customer segment, region, time period.

    5. Marketing Spend Allocation: Where Should We Invest?

    Old way: Marketing intuition + CFO’s historical analysis.
    AI way: “What’s the CAC and LTV by channel? Where should we increase/decrease spend?” → Scenario model shows impact on growth and payback period.

    6. Debt or Equity: How Should We Fund Growth?

    Old way: Weeks of analysis with CFO and lender discussions.
    AI way: “Given our cash flow and growth trajectory, can we service $500K in debt vs. raising equity?” → Model shows scenarios and implications.

    7. Cost Reduction: Where Should We Cut?

    Old way: Across-the-board cuts or consultants to identify savings.
    AI way: “What costs are trending highest? Where are we spending more than industry peers?” → Identify quick wins and strategic cuts.

    The CFO Alternative: AI-Powered Financial Advisors

    How They Work

    Step 1: Data Integration

    • Connect accounting software (QuickBooks, Xero, NetSuite)
    • Link banking and payment processors (Stripe, Square, PayPal)
    • Integrate CRM for customer data (Salesforce, HubSpot, Pipedrive)
    • Add operational data (inventory, HR, project management)

    Step 2: Intelligence Layer

    • AI analyzes data patterns and trends
    • Compares metrics against industry benchmarks
    • Models different scenarios and outcomes
    • Identifies risks and opportunities

    Step 3: Plain-English Guidance

    • “Your cash flow is tightening. At current burn rate, you have 6 months runway. Recommend accelerating revenue or reducing costs by $X/month.”
    • “You can safely hire 2 people this quarter and maintain 6-month runway.”
    • “Your LTV:CAC ratio is declining. Recommend testing new channels or improving retention.”

    Step 4: Actionable Tasks

    • AI generates specific action items with implementation steps
    • Prioritizes by impact and feasibility
    • Tracks progress and outcomes

    Comparing Financial Guidance Options

    OptionCostResponse TimeExpertiseScalabilityBest For
    Full-time CFO$150K-$300K/yearHours to daysHighestLimitedLarge companies ($50M+)
    Fractional CFO$5K-$15K/monthDays to weeksHighLimited$10M-$50M companies
    CFO Advisory Firms$300-$500/hourWeeksHighLimitedOne-off projects
    AI Advisor (Miivo)$399/month60 secondsContextualUnlimitedSMEs ($1M-$50M)
    Your own team$0 (sunk cost)DaysVariableLimitedOngoing operation

    How to Choose the Right Tool for Faster Decisions

    If You’re Currently Using a CFO (Part-time or Full-time)

    Consider supplementing with AI advisors for:

    • Filling gaps between scheduled CFO meetings (instant answers)
    • Running quick scenario models (instead of requesting formal analysis)
    • Continuous monitoring and alerts (instead of monthly reviews)
    • Freeing up CFO time for high-level strategy

    Cost: Often less expensive than CFO + produces faster insights

    You can also look for tool that enables small businesses to plan smarter.

    If You Don’t Have a CFO

    Key criteria for AI advisor selection:

    ✓ Real-time data integration (connects to your systems)

    ✓ Contextual insights (understands your specific business, not generic advice)

    ✓ Plain English explanations (not accounting jargon)

    ✓ Actionable recommendations (not just analysis)

    ✓ Scenario modeling (what-if analysis)

    ✓ Industry benchmarks (compare against peers)

    ✓ Mobile/chat access (get answers on the go)

    ✓ Affordable pricing (<$500/month for SMEs)

    Implementation: Moving from Slow to Fast Decision-Making

    Week 1: Setup & Integration

    • Choose your AI advisor platform
    • Connect data sources (accounting, banking, CRM)
    • Configure industry/business-type settings
    • Invite team members

    Week 2: Training & Onboarding

    • Team familiarization with dashboards and chat interface
    • Practice asking questions and interpreting answers
    • Establish decision-making workflows

    Week 3: Active Use

    • Start asking real business questions
    • Document decisions and outcomes
    • Refine which metrics matter most

    Week 4: Optimization

    • Review decision speed improvements
    • Adjust dashboards based on what matters
    • Establish weekly/monthly decision cycles

    The Business Impact of Faster Decisions

    Decision Speed Multiplier

    Businesses that go from slow (decisions every 30 days) to fast (decisions every week) see:

    • 3x faster optimization cycles
    • 2x faster error correction (catch problems sooner)
    • 20-30% faster growth (through continuous iteration)

    Real Numbers

    Slow Decision Business:

    • Quarterly strategy reviews: 1 per quarter
    • Monthly financial reviews: 1 per month
    • Strategic iterations per year: 4-12

    Fast Decision Business:

    • Weekly dashboards: 52 per year
    • Real-time alerts: 365+ per year
    • Strategic iterations per year: 52-104

    Over 3 years, fast-decision businesses make 100-200 more strategic iterations, leading to:

    • 25-40% higher growth rates
    • 15-25% higher margins (through continuous optimization)
    • 30-50% faster path to profitability

    Conclusion: Decisions Drive Outcomes

    You don’t need to hire a $250K CFO to make smart business decisions. You need access to real-time financial insights, benchmark comparisons, and scenario modeling capabilities all delivered in 60 seconds instead of 60 days.

    AI-powered financial advisors like Miivo give you exactly that. They level the playing field between well-funded companies with CFOs and lean startups without them.

    The result? Faster decisions, better outcomes, and higher growth.