Category: Uncategorized

  • What Are the Best Nume.ai Alternatives in 2026?

    What Are the Best Nume.ai Alternatives in 2026?

    Nume.ai is an AI-powered CFO platform for startup founders and SMEs. The financial system connects to QuickBooks, Xero, and bank accounts to provide real-time financial monitoring, instant reports, cash flow alerts, and board report generation, all powered by AI. At $100 per month for the Pro plan, it is significantly more affordable than comparable tools. The main reasons people look for an alternative is because they want a human expert besides the AI, need more FP&A depth, need bookkeeping included, or run a physical business that Nume.ai is not the right fit for.

    This article compares 7 best alternatives to Nume.ai in 2026. Miivo is reviewed first for physical business owners who need financial and operational data combined, something no other alternative here provides. The other six cover different needs for digital businesses and startups: Fuelfinance if you want a human financial manager included, Mosaic for deeper SaaS FP&A, Pry for an affordable early-stage option, LiveFlow if you prefer staying in spreadsheets, Float for cash flow specifically, and Jirav for mid-market complexity.

    This comparison focuses on small businesses and startups. Enterprise FP&A tools like Anaplan, Workday Adaptive, or Planful are acknowledged but not reviewed in depth because they require dedicated finance teams and hefty budgets.

    Comparison of The Best Nume.ai Alternatives in 2026

    Here is a quick summary before the full review of each.

    ToolMain FocusHuman Team IncludedBest Forvs Nume.aiStarting Price
    MiivoPhysical business BIYes (full team)Small physical businessesDifferent audience, has human teamFree,Starts from $399/month
    FuelfinanceFP&A + human managerYes (financial manager)Startups/agencies wanting human supportMore expensive, adds human managerCustom, Starts from $1,199/month
    Mosaic (acquired by HiBob)SaaS FP&ANoSaaS with finance teamMore FP&A depth, more expensiveCustom
    Pry (Brex)Cash runway + FP&ANoPre-Series A startupsCheaper, less depthFree, Starts from $12/user/month
    LiveFlowSpreadsheet syncNoAccountants, finance prosSpreadsheet-focused, no monitoringCustom quote, Starts from $200/month
    FloatCash flow forecastingNoService businesses, agenciesCash focus only, simplerFrom $130/month
    JiravMid-market FP&ANo$10M to $100M businessesMore complex, multi-entityCustom, From $10,000/year

    These tools cover the full spectrum of AI-powered financial management for startups and growing businesses. Each solves a different version of the same problem, which is to get accurate, actionable financial insight without a full-time finance team.

    Miivo: Business Intelligence Plus a Human Team, Built for Physical Businesses

    What Miivo Is

    Miivo is a business intelligence service with a dedicated human team for physical businesses. The BI platform uses AI to give small business owners financial visibility automatically, just like Nume.ai. Additionally, the tool connects operational data from the POS alongside financial data from accounting, and includes a dedicated human team that handles setup and interpretation from day one.

    Best For

    Restaurant owners, salon groups, gym operators, and retail businesses who want financial and operational data combined automatically, with a human team handling setup and interpretation.

    What Miivo Does Well

    • Miivo joins financial data from accounting, POS data (covers, average spend, product performance), and customer review data into one automatic daily dashboard. 
    • AI Warning Signals flag problems before they compound. 
    • Opportunity Cards surface specific actions you can take to improve margins. 
    • The dedicated human team handles all setup and interpretation, and the service goes live in 5 business days. 
    • Pricing is transparent with no hidden fees.

    What Miivo Does Not Do

    • Not an AI CFO platform for startups. 
    • Does not generate board reports, do scenario planning, or provide startup runway modeling. 
    • Not ideal for SaaS companies or digital businesses. It is best suited if the business has a physical location.

    Pricing

    Ready To Use: Free, no credit card required.

    Built For You: $399 per month. 

    Managed Services: at $1,299 per month. Setup included.

    See how Miivo works for physical businesses

    Fuelfinance: The Most Similar to Nume.ai, With a Human Financial Manager Added

    What Fuelfinance Is

    Fuelfinance is an FP&A platform for startups and agencies that combines AI forecasting, budget vs actual tracking, and scenario planning with a dedicated human financial manager included in the subscription. The finance tool is the closest alternative to Nume.ai in terms of audience, with the key difference being the addition of a human expert who understands your business and acts alongside the AI.

    Best For

    Startup founders and SMB owners who want both the AI financial software and a dedicated human financial manager. If the absence of human support is the main reason you are looking away from Nume.ai, Fuelfinance is the most direct replacement.

    What Fuelfinance Does Well

    • Combines AI forecasting, budget vs actual reporting, scenario planning, and anomaly detection with a dedicated financial manager who acts as a fractional CFO. 
    • The human-plus-AI combination is the biggest advantage over Nume.ai. 
    • Has an established track record, a broader user review history, and 350+ integrations across accounting, CRM, and data tools.

    What Fuelfinance Does Not Do

    • Fuelfinance is significantly more expensive than Nume.ai, starting at $1,199 per month compared to $100. 
    • Not built for physical businesses. 
    • There is no POS or operational data integration. 
    • The premium price reflects the human manager inclusion, so self-serve-only users who do not need that layer may not find the cost justified.

    Pricing 

    Pricing starts from $1,199 per month for 1st tier, $2,399 per month for the 2nd tier and higher tier plans are custom-quoted for established businesses. Fuelfinance does not offer a free trial.

    Mosaic: AI-Powered FP&A for SaaS and Growth-Stage Businesses

    What Mosaic Is

    Mosaic is an AI-powered FP&A platform built for SaaS companies and growth-stage businesses, now acquired by HiBob. The finance software connects with accounting systems like QuickBooks and NetSuite, CRM tools such as Salesforce and HubSpot, and billing platforms to build a unified financial model across the organization.

    Best For

    SaaS companies and growth-stage startups that have a finance team or CFO on board and need deeper financial modeling than Nume.ai’s monitoring and alert-focused approach.

    What Mosaic Does Well

    • Tracks SaaS-specific metrics, such as ARR, churn, CAC, and LTV, with precision. 
    • Includes AI-powered insights, anomaly detection, and headcount planning. 
    • The interface is clean and modern.
    • FP&A depth goes well beyond what Nume.ai offers for companies that have the internal capability to configure and maintain financial models.

    What Mosaic Does Not Do

    • Does not include a dedicated human financial manager. 
    • More expensive than Nume.ai and is best suited to companies with someone technical enough to build and maintain the models. 
    • Physical business data is not supported. 
    • Founders at the earliest stages, without a finance team, will likely find the complexity unnecessary.

    Pricing

    Custom pricing, typically $1,000 to $3,000+ per month. A demo is required before access.

    Pry (Brex): Cash Runway and FP&A for Early-Stage Startups

    What Pry Is

    Pry (now Brex) is a financial planning platform for early-stage startups that covers budget vs actual tracking, cash runway visualization, and hiring plan management. The financial software was acquired by Brex and positions itself as an accessible first step beyond spreadsheets for early-stage founders.

    Best For

    Pre-revenue to Series A founders who need to track runway, manage headcount forecasting, and run basic scenario planning on a tight budget. Pry is the most accessible starting point for founders who find Nume.ai either too expensive or more feature-rich than their current stage requires.

    What Pry Does Well

    • Offers a free plan. 
    • Syncs automatically with bank accounts for budget vs actual reporting, visualizes cash runway clearly.
    • Includes a hiring plan that tracks headcount and fully loaded employee costs. 
    • For simple business models at the earliest stage, it covers the core bases without a significant monthly commitment.

    What Pry Does Not Do

    • Does not include a dedicated human advisor. 
    • Feature depth is lighter than Nume.ai or Fuelfinance, and it works best for straightforward business models rather than complex financial structures. 
    • Physical business data is not supported.
    • Does not offer the proactive financial monitoring or board report generation that Nume.ai provides.

    Pricing

    Essentials: $0 per user per month. 

    Premium: $12 per user per month.

    Enterprise: Custom pricing.

    LiveFlow: FP&A That Lives Inside Google Sheets and Excel

    What LiveFlow Is

    LiveFlow is a tool that automatically syncs accounting data from QuickBooks, Xero, or NetSuite directly into existing Google Sheets and Excel models. The FP&A software removes the need to manually export data, while keeping finance professionals inside the spreadsheet environment they already use.

    Best For

    Finance professionals and accountants who want to keep working inside spreadsheets while automating the data pull from their accounting system. LiveFlow also supports multi-client management, which makes it practical for accounting firms managing multiple entities.

    What LiveFlow Does Well

    • Stays inside Google Sheets and Excel, so there is no new interface to learn. 
    • Data sync runs automatically, which completely removes the manual export-and-paste process that consumes time in most spreadsheet-based workflows. 
    • Affordable relative to most FP&A platforms
    • Handles multi-client setups cleanly.

    What LiveFlow Does Not Do

    • Requires comfort with spreadsheets. 
    • Not a monitoring or alert platform in the way Nume.ai is. 
    • No proactive signals, no AI Q&A, and no board report generation. 
    • If the reason you are looking away from Nume.ai is that you want more automation, LiveFlow moves in the opposite direction.
    • Physical business data is not supported.

    Pricing

    Custom pricing, typically ranges from $50-200+ per month to $1,500+ per month and even higher for multi-entity and enterprise-level businesses. Demo is required.

    Float: Cash Flow Forecasting Only

    What Float Is

    Float is a cash flow forecasting tool that connects directly with QuickBooks, Xero, and FreeAgent to build automated cash flow forecasts. The simple tool has a single, clearly defined focus and does not attempt to expand beyond it.

    Best For

    Service businesses and agencies that need to forecast their cash position week by week and avoid cash flow surprises. Float suits founders or finance managers who want a simple, visual tool for cash management instead of a full AI financial monitoring platform.

    What Float Does Well

    • Builds an automatic cash flow forecast from accounting data without complex setup. 
    • Scenario modeling allows users to test the impact of different decisions on cash position. 
    • The interface is visual and easy to read, and it is one of the more affordable dedicated tools on this list.

    What Float Does Not Do

    • Covers cash flow forecasting only, it is not a full AI CFO platform. 
    • There is no broader financial monitoring, no board report generation, no AI Q&A, and no anomaly detection across other financial metrics. 
    • No dedicated human advisor, and physical business data is not supported.

    Pricing

    Essentials: $130 per month. 

    Growth: $265 per month.

    Scale: Starts from $389 per month. 

    20% discount on annual billing. Pricing available in GBP, USD, AUD, and EUR. 14-day free trial.

    Jirav: Best Mid-Market FP&A Platform

    What Jirav Is

    Jirav is an FP&A platform built for mid-market and professional services companies. The finance tool combines financial and operational data across multiple entities or departments and is designed for organizations with more complexity than a typical early-stage startup carries.

    Best For

    Professional services firms and mid-market companies with revenue between $10 million and $100 million that need consolidated financial planning across multiple entities, departments, or business units. Jirav suits organizations that have grown past the capabilities of simpler tools and need multi-entity consolidation and effective headcount planning.

    What Jirav Does Well

    • Handles multi-entity consolidation with precision.
    • Combines operational and financial data into a unified view. 
    • Headcount planning and board-ready reporting are strong.
    • FP&A depth significantly exceeds what Nume.ai offers for companies operating at that level of complexity.

    What Jirav Does Not Do

    • More complex and more expensive than Nume.ai. 
    • Requires onboarding support to configure properly. 
    • There is no dedicated ongoing human advisor included in the subscription. 
    • Physical business data is not natively supported.
    • Pricing and complexity make it unsuitable for early-stage startups.

    Pricing 

    Custom pricing, not published. Mid-market range, typically $10,000+ annually.

    Which Nume.ai Alternative Is Right for Your Situation?

    Different situations call for different tools. Following are the most common reasons someone looks for a Nume.ai alternative, and the tool that fits each one.

    1. You run a physical business (restaurant, salon, gym, or retail) and need financial and operational data combined, not just financial monitoring: Miivo is the most suitable Nume.ai alternative, as it connects POS data alongside financial data and includes a dedicated human team that handles setup and interpretation. None of the other alternatives on this list connect to a POS system or serve physical business owners.
    2. You want an AI financial tool with a human expert you can actually speak to: Fuelfinance is the closest competitor, it combines AI forecasting with a dedicated human financial manager included in the subscription. It is more expensive than Nume.ai, but the human element is the key difference and the main reason to choose it over a pure AI alternative.
    3. You are an early-stage startup founder on a tight budget: Pry is the most accessible starting point. The tool has a free plan, covers budget vs actual tracking, cash runway, and hiring plan management without the monthly commitment that Fuelfinance or Mosaic requires.
    4. You want to keep working in Google Sheets or Excel with automated data sync: LiveFlow automates the data pull from QuickBooks or Xero into your existing spreadsheet models. The software does not force a new interface, and it keeps your workflow exactly where it already lives.
    5. You primarily need to forecast and manage cash flow: Float is the simplest, most focused option for managing cash flow only. It performs this one thing well, it is visual, it is affordable, and it does not require you to learn or configure a broader FP&A platform to get value from it.

    Running a Physical Business and Looking for a Nume.ai Alternative?

    Book a 15-minute call and we will connect to your data and show you what your financial and operational picture looks like inside Miivo.

    [Book a 15-minute call]

    *No credit card. No commitment. See your data first.

  • Best Small Business Analytics Platforms in 2026

    Best Small Business Analytics Platforms in 2026

    If you have searched for analytics tools recently, you have probably seen the same two categories of results. The first is web and marketing analytics: Google Analytics, Mixpanel, HubSpot. These track website visitors and marketing campaigns. The second is self-serve BI platforms: Zoho Analytics, Power BI, Looker Studio. These let you build your own dashboards from existing data. Both categories are genuinely useful for certain businesses. If you run a physical business, a restaurant, a salon, a gym, or a retail shop, most of those tools track the wrong things. This guide focuses on the analytics platforms that connect to the data a physical business actually generates: sales, operations, costs, and customer reviews. Not website clicks.

    This comparison reviews 7 platforms relevant to small physical businesses in 2026: Miivo, Zoho Analytics, Klipfolio, Databox, Looker Studio, Power BI, and Google Analytics 4. Each one is reviewed on what it actually is, who it is built for, what it does well, and what it does not do. A comparison table and a decision framework help you find the right fit for your situation.

    This comparison is written for independent business owners running one to five physical locations. Enterprise buyers and businesses with dedicated data teams will find more relevant options among platforms like Tableau, Sisense, or ThoughtSpot. This page does not review those tools in depth because they are not designed for an independent owner-operator with limited time and no IT staff.

    All 7 Platforms At A Glance

    Here is a quick overview before the full review of each platform below.

    PlatformWhat Type of AnalyticsBest ForBiggest LimitationStarting Price
    MiivoDone-for-you BI (financial, operational, reviews)Physical SMBs wanting automatic, combined data viewsNot a web or marketing analytics toolFree / $399/month
    Zoho AnalyticsSelf-serve BI and reportingSMBs comfortable building their own dashboardsSelf-serve only, limited native POS integrationFree / $30/month
    KlipfolioReal-time KPI dashboardsBusinesses wanting live dashboards from multiple toolsNo physical business native connectors, no human teamFrom $90/month
    DataboxMulti-source metrics dashboardConsolidating digital marketing and sales metricsPrimarily digital/marketing data, limited physical business fitFree / $47/month
    Looker StudioFree dashboard builder (Google ecosystem)Businesses using Google Analytics and Google AdsNot a BI platform, no POS or accounting connectionFree
    Power BIEnterprise BI (Microsoft)Organisations with a data engineer or IT staffRequires technical resource, setup cost is significant$10/user/month + setup
    Google Analytics 4Web analytics onlyAny business wanting to understand website visitorsTracks website data only, no POS, accounting, or operational dataFree

    Miivo: Business Intelligence for Physical Small Businesses, Done for You

    What Miivo Is

    Miivo is an AI-powered business intelligence service with a dedicated human team. In contrast to all the other platforms in this comparison, Miivo is done for you, which means the team connects your data sources, builds a combined dashboard, monitors the business, and highlights what needs attention automatically, without the owner configuring or interpreting anything.

    Best For

    Independent small physical businesses, such as restaurants, salons, gyms, and retail shops with one to five locations, that want to see their financial and operational data in one place, without building or maintaining anything themselves.

    What Miivo Does Well

    • Connects financial data from accounting, operational data from the POS, and customer review data from Google and other platforms into one automatic daily view.
    • AI Warning Signals flag problems before they grow.
    • Opportunity Cards surface specific actions the business can take.
    • A dedicated human team handles setup, maintenance, and interpretation throughout.
    • Goes live in 5 business days, with transparent pricing and no hidden setup costs.

    For a single-location restaurant, that 5-day window covers connecting the POS and the accounting file. The owner does not touch a dashboard builder at any point in the process.

    What Miivo Does Not Do

    • Miivo is not a web analytics or marketing analytics platform. It does not track website traffic or campaign performance. 
    • Not built for digital-only businesses or businesses with internal data teams wanting custom reports. 
    • Does not replace a POS or accounting software.

    Pricing: Ready to Use for free, Built for You at $399/month. Managed Services at $1,299/month. Setup included. No hardware costs.

    See how Miivo works for small physical businesses

    Zoho Analytics: Affordable Self-Serve BI for Small Businesses

    What Zoho Analytics Is

    Zoho Analytics is a self-service BI and reporting platform built for SMBs. It offers drag-and-drop dashboard creation, an AI assistant called Zia that responds to natural language queries, and more than 100 integrations. The business analytics platform gives small businesses a capable and affordable way to build reports from data they already collect.

    Best For

    Small businesses that are comfortable building and maintaining their own reports from clean, organized data. It suits teams that want a capable self-serve BI platform without a large upfront investment.

    What Zoho Analytics Does Well

    • Accessible entry price, including a free tier.
    • Drag-and-drop interface and Zia’s natural language queries, so basic setup requires minimal technical expertise.
    • Scales as the business grows and connects to a wide library of third-party tools. 

    What Zoho Analytics Does Not Do

    • Zoho Analytics is self-serve only, which means the owner builds and maintains everything. 
    • There is no human team, no automatic flagging of problems, and no proactive monitoring. 
    • Does not natively connect to POS systems or restaurant-specific platforms. 
    • Multi-location views require manual setup. 
    • Competitor monitoring and review tracking are not included.

    Pricing: Free plan (2 users, limited rows). Basic from $30/month. Standard from $60/month.

    Klipfolio: Real-Time KPI Dashboards From Multiple Data Sources

    What Klipfolio Is

    Klipfolio is a cloud-based KPI dashboard tool that connects to more than 1,000 data sources and displays live metrics across business functions. The analytics platform is built for businesses that want real-time visibility across multiple tools in one place.

    Best For

    Small businesses that want real-time dashboards pulling from multiple existing tools, like accounting, marketing, and sales, and have someone available to configure and maintain the setup.

    What Klipfolio Does Well

    • Offers an extensive connector library and live dashboards that update as data changes.
    • Flexible visualization options, practical for displaying metrics on shared team screens.
    • Standard setup does not require SQL knowledge, and the interface is accessible for non-technical users working with supported data sources.

    What Klipfolio Does Not Do

    • Klipfolio is self-serve, so setup and ongoing maintenance fall to the owner or a team member. 
    • Does not connect natively to POS or hospitality-specific platforms. 
    • There is no human team to interpret data.
    • No automatic AI flagging.
    • No proactive monitoring built specifically for physical SMBs.

    Pricing: Basic from $90/month. Professional from $225/month.

    Databox: All-in-One Metrics Dashboard for Marketing and Operations

    What Databox Is

    Databox is a dashboard platform that aggregates metrics from multiple tools into mobile-ready dashboards. The analytics platform focuses on KPI tracking and goal monitoring, with more than 100 one-click integrations targeting digital marketing and sales data sources.

    Best For

    Small businesses and marketing teams that want to consolidate metrics from several existing digital tools, such as HubSpot, Shopify, Google Ads, and QuickBooks, into one view.

    What Databox Does Well

    • One-click integrations, goal tracking, mobile dashboards, and period-over-period comparisons.
    • Free tier makes it accessible for businesses starting out.
    • Works well for consolidating marketing and sales metric tracking across digital channels.

    What Databox Does Not Do

    • Primarily built for digital and marketing metrics. 
    • Limited native integration with POS systems or physical business data sources. 
    • Self-serve configuration is required. 
    • No human team for interpretation and no proactive flagging beyond basic threshold alerts.

    Pricing: Free plan (3 data sources). Starter from $47/month. Professional from $135/month.

    Looker Studio (now Data Studio): A Free Tool for Building Your Own Reports

    What Looker Studio Is

    Google Looker Studio (now Data Studio) is a free dashboarding tool that connects strongly to Google products, such as GA4, Google Ads, Search Console, and Sheets, along with more than 1,000 community connectors. The reporting tool produces shareable, visual reports from data the user supplies.

    Best For

    Businesses that use Google Analytics or Google Ads and want a free reporting layer with someone willing to build and maintain their own reports.

    What Looker Studio Does Well

    • Core product is completely free.
    • Dashboards are easy to share with stakeholders.
    • Integration with the Google ecosystem is strong, and basic use does not require technical knowledge.
    • Works well for website traffic and marketing campaign reporting.

    What Looker Studio Does Not Do

    • Looker Studio is not a business intelligence platform for physical businesses. 
    • No native connection to POS or accounting software. Connecting those data sources requires third-party connectors that often carry additional costs. 
    • No automatic alerts.
    • No multi-location views without manual builds per site.
    • No team or interpretation support.

    Pricing: Free. Pro at $9/user/month. Third-party connector costs vary.

    Power BI: The Most Capable Platform on This List, If You Have the Technical Resource

    What Power BI Is

    Power BI is Microsoft’s enterprise BI and analytics platform and offers industry-leading analytical capability once set up correctly. According to the latest industry data, it is used by 97% of Fortune 500 companies. The BI platform operates within the Microsoft 365 ecosystem and connects to hundreds of data sources.

    Best For

    Mid-to-large organizations with a data engineering team or IT department, or businesses already deep in the Microsoft 365 ecosystem with someone technical on staff.

    What Power BI Does Well

    • Extremely powerful when configured correctly.
    • Deep integration with Microsoft 365, Excel, and Azure.
    • Real-time data with Direct Lake.
    • Strong governance and security controls.
    • Hundreds of connectors support a wide range of data sources for businesses with the internal resources to build and maintain models.

    What Power BI Does Not Do

    • Requires a data engineer or technically skilled person to build and maintain data models. Most independent small business owners cannot do this themselves. 
    • Connecting POS or hospitality data requires custom development work. 
    • The apparent low subscription price hides significant engineering time costs that make the real investment substantially higher.

    Pricing: Power BI Pro at $10/user/month. Data engineering cost additional and significant.

    Google Analytics 4: Website Analytics, Not Business Analytics

    What GA4 Is

    Google Analytics 4 tracks website visitor behavior, traffic sources, and online conversions. It is web analytics, not business intelligence for a physical business.

    Best For

    Any business with a website that wants to understand where visitors come from and what they do on the site.

    What GA4 Does Well

    • Free and the most widely used web analytics platform. 
    • Integrates strongly with Google Ads.
    • Machine learning identifies trends automatically.

    What GA4 Does Not Do

    • No connection to POS systems, booking platforms, accounting software, or physical location data. 

    A restaurant can use GA4 to track website visitors but not in-store revenue, covers, or margins.

    Pricing: Free.

    How All 7 Platforms Compare Side by Side

    Here is how all 7 platforms compare across the features that matter most for a physical small business.

    FeatureMiivoZoho AnalyticsKlipfolioDataboxLooker StudioPower BIGA4
    Financial data and P&LYes ✅ (via accounting)Partial ⭕Partial ⭕Partial ⭕No ❌Partial ⭕ (if built)No ❌
    POS integration for physical businessesYes ✅ (50+ systems)Partial ⭕Partial ⭕Partial ⭕No ❌No ❌No ❌
    Review and reputation trackingYes ✅No ❌No ❌No ❌No ❌No ❌No ❌
    Done-for-you setup and human teamYes ✅No ❌No ❌No ❌No ❌No ❌No ❌
    AI automatic alerts and flaggingYes ✅ (Warning Signals)Partial ⭕ (Zia queries only)No ❌Partial ⭕ (basic alerts)No ❌Partial ⭕Partial ⭕ (anomaly detection)
    Website and marketing analyticsNoPartial ⭕Partial ⭕Yes ✅No ❌No ❌Yes ✅
    Physical business without data teamYes ✅Partial ⭕Partial ⭕Partial ⭕Yes ✅ (limited)No ❌Yes ✅ (limited)
    Entry pricingFree / $399/monthFree / $30/monthFrom $90/monthFree / $47/monthFree$10/user/month + setupFree

    Which Analytics Platform Fits Your Business

    Small businesses are of various types and require a distinct business analytics platform that perfectly fits their needs. Carefully analyze your business needs first to pick the platform most suitable for your business.

    You run a physical business and want to see your financial and operational data automatically, without building anything: Miivo is the only done-for-you option among the best small business analytics platforms that connects physical business data, including POS, accounting, and reviews, into one automatic daily view. It is the right fit when the main gap is visibility without setup effort. No dashboard to configure, no integrations to maintain.

    You are comfortable building your own dashboards and want an affordable self-serve platform: Zoho Analytics is a strong self-serve option at this price point. The wide integration library, drag-and-drop interface, and AI assistant make it accessible without technical expertise. Expect to invest time in the initial setup and ongoing maintenance.

    You just want to consolidate metrics from several existing digital tools into one live dashboard: Klipfolio and Databox both handle this well. Klipfolio has a larger connector library and performs better for real-time KPI displays across team screens. Databox is more affordable at entry level and offers stronger goal tracking for businesses focused on sales and marketing metrics.

    You have a website and primarily want to understand your online visitors and marketing campaigns: Google Analytics 4 is free and the most capable web analytics platform available. Pair it with Looker Studio for free custom reporting when you need to control how the data is presented.

    You have a data person or IT staff and are already in the Microsoft ecosystem: Power BI is the most capable analytics platform on this list once fully configured. The investment in data engineering time pays off when the business has the internal resources to build and maintain models over time. 

    FAQs

    What is the difference between web analytics and business intelligence for a physical business?

    Web analytics tools such as GA4 track website visitors and campaigns. Business intelligence platforms such as Miivo, Zoho Analytics, and Power BI connect to POS, accounting, and operational data, the systems a restaurant, salon, gym, or retail shop actually runs on.

    Do these platforms connect to POS systems?

    Miivo connects to more than 50 POS systems. Zoho Analytics, Klipfolio, and Databox offer partial or third-party POS connections. Looker Studio, Power BI, and GA4 have no native POS connection.

    Which platform requires the least setup work?

    Miivo is done for you, which means that the team builds the dashboard and it goes live within 5 business days. Looker Studio and GA4 are free but require the owner to build reports. Zoho Analytics, Klipfolio, and Databox are self-serve, so setup time depends on how many data sources are connected.

    Is Power BI a good fit for a single-location small business?

    Power BI is built for organizations with a data engineer or IT department. For a single-location small business without a technical resource, the setup and engineering cost is the main barrier, not the $10 per user subscription itself.

    What does a done-for-you platform like Miivo cost compared to self-serve tools?

    Miivo’s paid plan starts at $399 per month. Self-serve tools range from free (Looker Studio, GA4, and the free tiers of Zoho Analytics and Databox) to $90/month and up (Klipfolio). The self-serve options cost less upfront but require the owner’s time and cost to build and maintain.

    See What Your Business Data Looks Like Inside Miivo

    Book a 15-minute call. We will pull your business data and show you what it looks like inside Miivo before you commit to anything.

    [Book a 15-minute call]

    *No credit card required. No commitment. See your data first.
  • How to Make Faster Business Decisions Without Hiring a CFO

    Introduction: The CFO Affordability Crisis

    You need financial expertise to make smart growth decisions. Fortunately, there are business decision making tools that can help guide you even if hiring a CFO costs $150,000-$300,000+ annually more than many small business owners can justify.

    What’s the alternative? Fly blind and hope your instincts work out?

    According to McKinsey’s SME Growth Report 2024, businesses making strategic decisions based on financial data grow 3.2x faster than those relying on intuition alone. Yet most SMEs don’t have access to CFO-level financial expertise.

    The gap between “knowing you need data-driven decisions” and “having the means to get expert financial guidance” has created an opportunity for AI-powered business advisors.

    In this guide, we’ll explore how modern SMEs are making faster, better business decisions without the CFO price tag and how you can too.

    Why CFO-Level Guidance Matters (But Hiring a CFO Doesn’t Make Sense)

    The Decision Speed Problem

    Your business faces constant choices:

    • Should we hire that sales person now or wait until Q2?
    • Do we expand to a new location?
    • Should we increase marketing spend by 30%?
    • Is this new product line actually profitable?
    • Should we take on venture capital or bootstrap?

    Without financial context, these are pure guesses. With financial context, they become calculated decisions.

    The best CFOs don’t just report what happened—they connect financial data to business outcomes, offering probabilistic guidance:

    “Based on our cash position ($150K), runway (8 months), and customer acquisition cost ($450), we can safely hire one sales person now and another in Q2. This maintains 6-month cash runway while accelerating growth.”

    That kind of clarity is worth its weight in gold. But it requires someone who:

    1. Understands your specific numbers
    2. Has context about your industry benchmarks
    3. Can model scenarios and understand trade-offs
    4. Can explain recommendations in business terms (not accounting jargon)

    The Cost Barrier

    Full-time CFO: $150K-$300K+ annually
    Fractional CFO (part-time): $5,000-$15,000/month ($60K-$180K/year)
    Big Four advisory: $300-$500/hour+

    For most SMEs, this is unaffordable. Especially when the business might not need 40 hours/week of CFO time—maybe 5-10 hours/week would suffice.

    The Solution Gap

    What SMEs actually need:

    • Real-time financial visibility (not month-end reports)
    • Quick answers to specific questions (not lengthy consulting engagements)
    • Scenario modeling (what if we raised prices 5%? hired 2 people?)
    • Actionable recommendations (not just analysis)
    • Affordable access to this guidance

    This is where AI-powered business advisors like Miivo step in.

    How AI Advisors Deliver CFO-Level Insights in 60 Seconds

    The Traditional CFO Workflow

    1. Request: You ask the CFO a question
    2. Data gathering: CFO pulls data from multiple systems (5-15 minutes)
    3. Analysis: CFO analyzes and models scenarios (30-120 minutes)
    4. Interpretation: CFO explains findings and recommendations (15-30 minutes)
    5. Decision: You make decision (could take days due to CFO availability)

    Total time: 1-4 hours per decision (spread across multiple days or weeks)

    The AI Advisor Workflow

    1. Question: You ask via chat/app
    2. Instant analysis: AI already has your data integrated, runs analysis in seconds
    3. Explanation: AI provides findings in plain English with recommendations
    4. Decision: You decide immediately

    Total time: 60 seconds to 5 minutes per decision

    What This Enables

    • Faster iteration: Instead of quarterly strategic reviews, you can test decisions weekly.
    • Better calibration: You see impact of decisions faster, course-correct more quickly.
    • Higher confidence: Data-driven decisions reduce decision paralysis and second-guessing.
    • Continuous optimization: Small improvements compound into significant results over time.

    Real-World Example: How a $5M SaaS Company Made Better Decisions Faster

    The Situation:
    Mike’s SaaS company had $5M ARR but was growing only 8% quarter-over-quarter. It should be growing 20%+. He had several theories about what to fix:

    • Hire more salespeople?
    • Increase marketing spend?
    • Improve product-market fit?
    • Lower churn?

    Without a CFO to analyze unit economics, he couldn’t tell which would have the biggest impact.

    The Old Way:
    Mike would have hired a fractional CFO ($10K/month) for 3 months to analyze the situation ($30K total). The analysis would take weeks and might recommend sales hiring (but Mike’s gut said marketing was the issue).

    With AI Advisor (Miivo):
    Mike connected his systems and asked: “What’s our unit economics breakdown, and which lever has the biggest impact on growth?”

    Instant answer:

    • Customer Acquisition Cost (CAC): $1,200
    • Lifetime Value (LTV): $6,000 (LTV:CAC ratio 5:1, healthy)
    • Growth bottleneck: Churn spiking at 8% monthly (vs. 4% industry average)
    • Recommendation: Focus on retention before acquiring new customers. Hire customer success, reduce churn to 5%. This alone would improve growth from 8% to 14% without additional marketing spend.

    Impact: Mike hired one customer success person (+$60K/year cost) and reduced churn to 5% within 90 days. Net result: Growth accelerated to 15%, and LTV:CAC improved from 5:1 to 7.5:1.

    ROI: Mike saved $30K in consulting fees, avoided expensive hiring mistakes, and generated $500K+ in additional ARR.

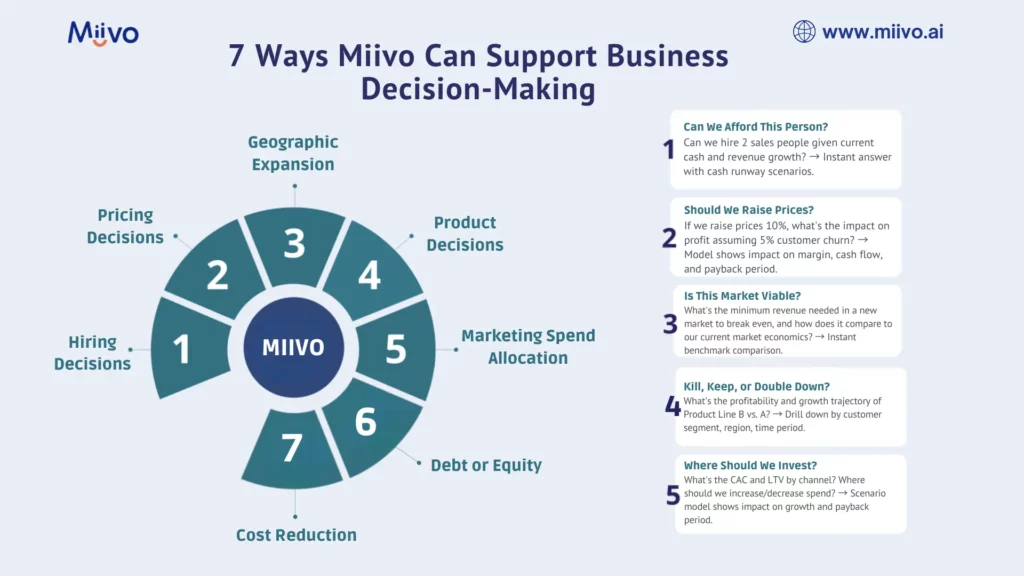
    7 Key Business Decisions AI Advisors Help You Make Faster

    1. Hiring Decisions: Can We Afford This Person?

    Old way: Guess based on feeling, or ask your accountant for a job cost analysis (takes 5-10 days).
    AI way: “Can we hire 2 sales people given current cash and revenue growth?” → Instant answer with cash runway scenarios.

    2. Pricing Decisions: Should We Raise Prices?

    Old way: Research competitors, gut feel, maybe a CFO analysis of margin impact.
    AI way: “If we raise prices 10%, what’s the impact on profit assuming 5% customer churn?” → Model shows impact on margin, cash flow, and payback period.

    3. Geographic Expansion: Is This Market Viable?

    Old way: Lengthy market analysis, risk assessment discussions.
    AI way: “What’s the minimum revenue needed in a new market to break even, and how does it compare to our current market economics?” → Instant benchmark comparison.

    4. Product Decisions: Kill, Keep, or Double Down?

    Old way: Product review meetings, margin analysis, guesswork.
    AI way: “What’s the profitability and growth trajectory of Product Line B vs. A?” → Drill down by customer segment, region, time period.

    5. Marketing Spend Allocation: Where Should We Invest?

    Old way: Marketing intuition + CFO’s historical analysis.
    AI way: “What’s the CAC and LTV by channel? Where should we increase/decrease spend?” → Scenario model shows impact on growth and payback period.

    6. Debt or Equity: How Should We Fund Growth?

    Old way: Weeks of analysis with CFO and lender discussions.
    AI way: “Given our cash flow and growth trajectory, can we service $500K in debt vs. raising equity?” → Model shows scenarios and implications.

    7. Cost Reduction: Where Should We Cut?

    Old way: Across-the-board cuts or consultants to identify savings.
    AI way: “What costs are trending highest? Where are we spending more than industry peers?” → Identify quick wins and strategic cuts.

    The CFO Alternative: AI-Powered Financial Advisors

    How They Work

    Step 1: Data Integration

    • Connect accounting software (QuickBooks, Xero, NetSuite)
    • Link banking and payment processors (Stripe, Square, PayPal)
    • Integrate CRM for customer data (Salesforce, HubSpot, Pipedrive)
    • Add operational data (inventory, HR, project management)

    Step 2: Intelligence Layer

    • AI analyzes data patterns and trends
    • Compares metrics against industry benchmarks
    • Models different scenarios and outcomes
    • Identifies risks and opportunities

    Step 3: Plain-English Guidance

    • “Your cash flow is tightening. At current burn rate, you have 6 months runway. Recommend accelerating revenue or reducing costs by $X/month.”
    • “You can safely hire 2 people this quarter and maintain 6-month runway.”
    • “Your LTV:CAC ratio is declining. Recommend testing new channels or improving retention.”

    Step 4: Actionable Tasks

    • AI generates specific action items with implementation steps
    • Prioritizes by impact and feasibility
    • Tracks progress and outcomes

    Comparing Financial Guidance Options

    OptionCostResponse TimeExpertiseScalabilityBest For
    Full-time CFO$150K-$300K/yearHours to daysHighestLimitedLarge companies ($50M+)
    Fractional CFO$5K-$15K/monthDays to weeksHighLimited$10M-$50M companies
    CFO Advisory Firms$300-$500/hourWeeksHighLimitedOne-off projects
    AI Advisor (Miivo)$399/month60 secondsContextualUnlimitedSMEs ($1M-$50M)
    Your own team$0 (sunk cost)DaysVariableLimitedOngoing operation

    How to Choose the Right Tool for Faster Decisions

    If You’re Currently Using a CFO (Part-time or Full-time)

    Consider supplementing with AI advisors for:

    • Filling gaps between scheduled CFO meetings (instant answers)
    • Running quick scenario models (instead of requesting formal analysis)
    • Continuous monitoring and alerts (instead of monthly reviews)
    • Freeing up CFO time for high-level strategy

    Cost: Often less expensive than CFO + produces faster insights

    You can also look for tool that enables small businesses to plan smarter.

    If You Don’t Have a CFO

    Key criteria for AI advisor selection:

    ✓ Real-time data integration (connects to your systems)

    ✓ Contextual insights (understands your specific business, not generic advice)

    ✓ Plain English explanations (not accounting jargon)

    ✓ Actionable recommendations (not just analysis)

    ✓ Scenario modeling (what-if analysis)

    ✓ Industry benchmarks (compare against peers)

    ✓ Mobile/chat access (get answers on the go)

    ✓ Affordable pricing (<$500/month for SMEs)

    Implementation: Moving from Slow to Fast Decision-Making

    Week 1: Setup & Integration

    • Choose your AI advisor platform
    • Connect data sources (accounting, banking, CRM)
    • Configure industry/business-type settings
    • Invite team members

    Week 2: Training & Onboarding

    • Team familiarization with dashboards and chat interface
    • Practice asking questions and interpreting answers
    • Establish decision-making workflows

    Week 3: Active Use

    • Start asking real business questions
    • Document decisions and outcomes
    • Refine which metrics matter most

    Week 4: Optimization

    • Review decision speed improvements
    • Adjust dashboards based on what matters
    • Establish weekly/monthly decision cycles

    The Business Impact of Faster Decisions

    Decision Speed Multiplier

    Businesses that go from slow (decisions every 30 days) to fast (decisions every week) see:

    • 3x faster optimization cycles
    • 2x faster error correction (catch problems sooner)
    • 20-30% faster growth (through continuous iteration)

    Real Numbers

    Slow Decision Business:

    • Quarterly strategy reviews: 1 per quarter
    • Monthly financial reviews: 1 per month
    • Strategic iterations per year: 4-12

    Fast Decision Business:

    • Weekly dashboards: 52 per year
    • Real-time alerts: 365+ per year
    • Strategic iterations per year: 52-104

    Over 3 years, fast-decision businesses make 100-200 more strategic iterations, leading to:

    • 25-40% higher growth rates
    • 15-25% higher margins (through continuous optimization)
    • 30-50% faster path to profitability

    Conclusion: Decisions Drive Outcomes

    You don’t need to hire a $250K CFO to make smart business decisions. You need access to real-time financial insights, benchmark comparisons, and scenario modeling capabilities all delivered in 60 seconds instead of 60 days.

    AI-powered financial advisors like Miivo give you exactly that. They level the playing field between well-funded companies with CFOs and lean startups without them.

    The result? Faster decisions, better outcomes, and higher growth.

  • Multi-Location Business Owners: How to Stop the Financial Data Chaos

    Introduction: The Multi-Location Nightmare

    You own three retail stores. Each location has its own manager, POS system, and way of tracking expenses. These are all common scenarios when dealing with multi-location financial management. Your accountant requests data from each location separately. You spend hours every week consolidating spreadsheets. By the time you have a complete financial picture, it’s already outdated.
    Sound familiar?

    Multi-location business owners face a unique challenge: financial visibility becomes exponentially harder as you expand. What worked with one location breaks down at three. What barely functioned at three becomes impossible at ten.

    According to the Small Business Trends Report 2025, 72% of multi-location business owners report significant challenges in consolidating financial data across locations, leading to delayed insights, missed cost-saving opportunities, and inconsistent profitability metrics.

    The good news? Modern technology can eliminate this chaos entirely.

    In this guide, we’ll explore the real costs of financial data fragmentation, why consolidation matters, and how tools like Miivo help multi-location businesses achieve real-time financial visibility across all operations.

    The Multi-Location Financial Data Crisis

    Why Data Silos Destroy Profitability

    When you operate multiple locations, each one generates financial data independently:

    • POS systems record sales and transactions
    • Accounting software tracks expenses, payroll, inventory
    • Bank accounts show cash positions at each location
    • Payment processors (Stripe, Square, PayPal) handle different payment methods
    • Inventory systems may be completely separate or incompatible

    Without a central system pulling all this data together, you face critical problems. Below are some common financial problems businesses faces.

    Impact of fragmented data

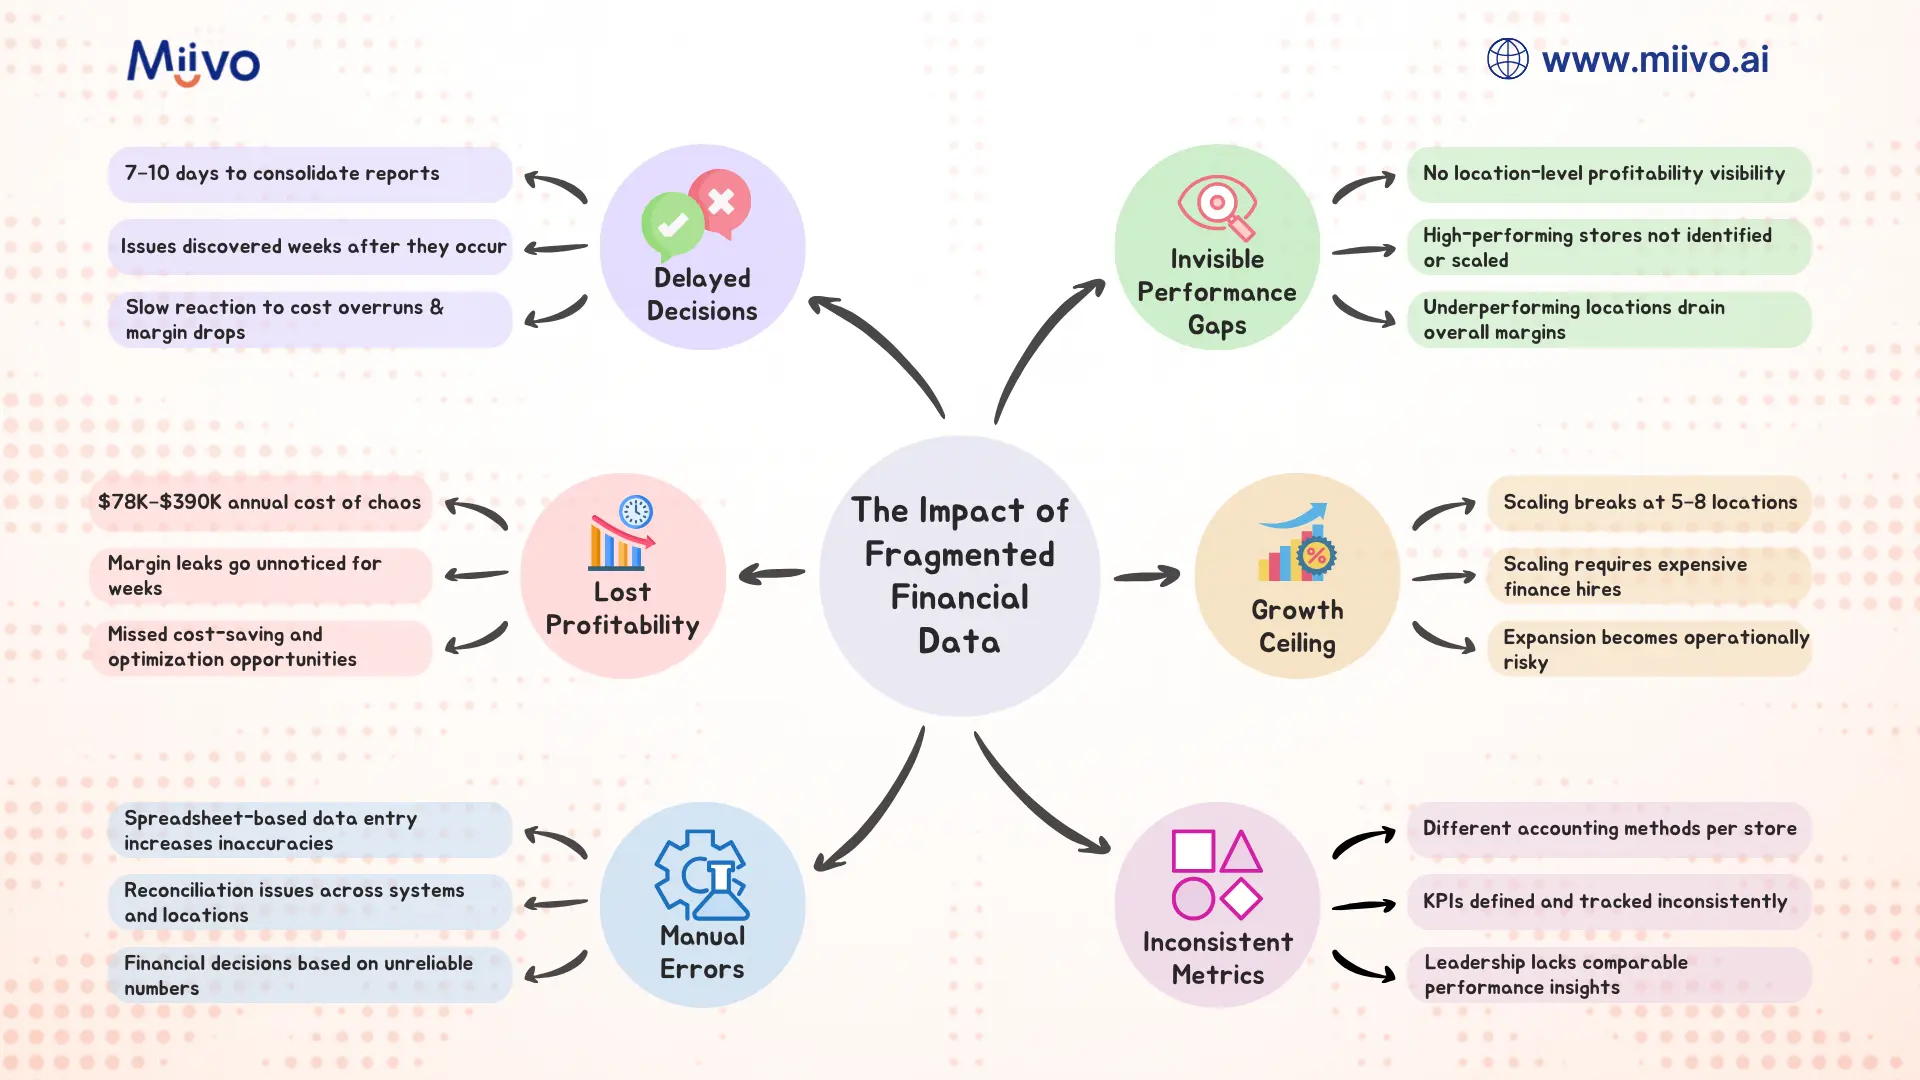
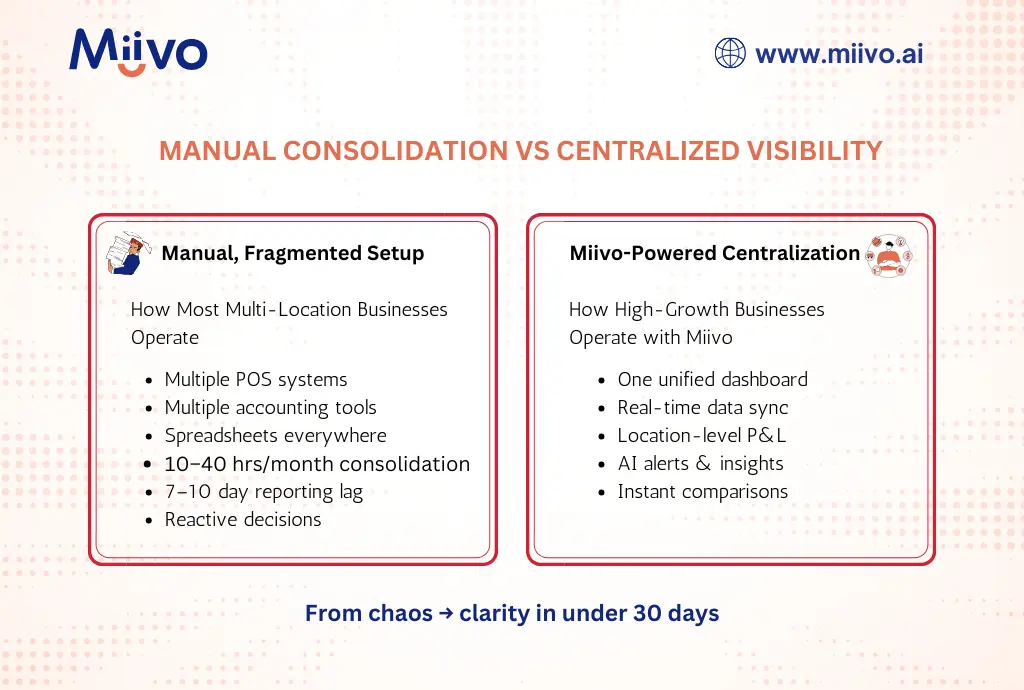
    Problem 1: The Consolidation Tax (10-20 Hours/Month)

    Your finance team spends countless hours manually pulling data from each location:

    • Logging into multiple accounting systems
    • Downloading reports from various platforms
    • Copying data into master spreadsheets
    • Reconciling discrepancies and fixing errors
    • Recalculating metrics for the consolidated view

    For a 3-location business with a part-time bookkeeper, this “consolidation tax” equals 10-15 hours monthly. At $50/hour, that’s $500-$750/month in pure overhead—time that could go toward strategic analysis instead.

    For a 10-location business? You’re looking at 30-40 hours monthly, or $1,500-$2,000 in wasted labor costs.

    Problem 2: Delayed Visibility = Missed Opportunities

    Manual consolidation typically takes 7-10 days after month-end. By then:

    • A location’s profitability crisis has already spiraled
    • Cost overrun has gone unchecked for weeks
    • Seasonal trend opportunity has passed
    • A competitor’s pricing shift is already affecting your margins

    McKinsey’s research on multi-unit retail operations found that businesses with real-time, location-level financial visibility made strategic adjustments 6-8 weeks faster than those relying on consolidated month-end reports.

    This speed advantage compounds: a business that catches and corrects a location-level profitability issue in week 2 (vs. week 6) captures 4 weeks of margin recovery, potentially worth $5,000-$25,000 depending on location size and profit margins.

    Problem 3: Invisible Profitability Gaps

    Without location-level profitability analysis, you can’t see critical trends:

    • Location A is highly profitable, Location B is barely breaking even, and you have no idea why
    • Store 1 has 15% shrink, Store 2 has 3%, but you’re managing inventory system-wide
    • Location 3’s customer acquisition cost is double the others, yet you’re using the same marketing budget allocation
    • One location’s labor costs are 35% of revenue while another’s are 28%, and you haven’t noticed

    These invisible gaps mean you’re likely overstaffing low-performing locations and under-resourcecing winners, systematically destroying profitability. 

    Problem 4: Inconsistent Reporting & Decision-Making

    Different locations report different metrics in different formats. Your stores use different accounting methods. One uses cash accounting, another accrual. One categorizes “supplies” differently than another.

    When the CEO requests “profitability by location,” you spend hours standardizing definitions, recalculating, and reconciling. By then, the decision window has passed.

    Result? Strategic decisions are made on incomplete or unreliable data, leading to poor allocation of capital, talent, and marketing resources.

    Problem 5: Scalability Ceiling

    Here’s the hard truth: manual consolidation doesn’t scale. You can barely handle 3 locations. At 5-7 locations, your finance person is drowning. At 10+ locations, manual processes completely break.

    Many multi-location businesses hit this “growth ceiling” at 5-8 locations and can’t scale further without hiring full-time finance staff—a $60-100K annual expense that doesn’t generate revenue.

    The Real Cost of Financial Data Chaos

    Direct Costs

    • Labor: 10-40 hours/month at $50/hour = $500-$2,000/month
    • Software: Duplicate accounting software licenses for each location = $100-$500/month
    • Errors: Manual data entry mistakes requiring correction = $1,000-$5,000/month (understated)
    • Missed opportunities: Delayed visibility costing margin recovery = $5,000-$25,000/month

    Total Monthly Cost: $6,500-$32,500

    Annual Cost of Chaos: $78,000-$390,000

    Indirect Costs

    • Decision delays: Strategies implemented 6-8 weeks late lose compounding advantage
    • Inconsistent execution: Locations operate with different rules, metrics, and priorities
    • Talent constraints: Finance team overwhelmed with data consolidation, no capacity for analysis
    • Growth paralysis: Can’t scale to new locations without major operational restructuring
    • Investor/lender concerns: Inconsistent financial reporting raises red flags during fundraising or refinancing

    The Solution: Centralized Financial Visibility

    What Centralized Visibility Looks Like

    Imagine this: Every morning, you open a single dashboard and instantly see:

    • Real-time sales data from all locations
    • Profitability by location (with unit economics drill-down)
    • Labor cost allocation by store
    • Inventory position across all locations
    • Cash position aggregated and by location
    • Key metrics (margin %, traffic, AOV, labor cost %, shrink) with location-level comparisons

    All data is current to yesterday, automatically consolidated, and pre-calculated. No spreadsheets. No manual work.

    You notice Location 2 is trending negative on margin. You drill into the dashboard and see it’s due to labor costs spiking after a seasonal hire didn’t work out. You send a message to the Location 2 manager with recommendations. Problem solved before it metastasizes.

    You compare Location 3’s profitability to Location 1 and notice Location 3 has higher shrink. You investigate and find an inventory tracking issue that’s been costing $2,000/month. Fixed in an afternoon.

    This is centralized financial visibility in action and it’s transformable.

    How Miivo Solves Multi-Location Chaos

    Miivo is specifically designed for businesses like yours:

    Manual setup vs Miivo powered centralized setup

    1. One-Click Consolidation
      • Connect all your POS systems, accounting software, bank accounts, and inventory systems
      • Miivo automatically pulls data from each location in real-time
      • Zero manual data entry required
    1. Location-Level Profitability Analysis
      • See profit & loss by store, down to the SKU level
      • Compare unit economics across locations (AOV, conversion rate, customer acquisition cost)
      • Identify high-performers and under performers instantly
    1. Standardized Metrics
      • All locations report using the same definitions and accounting methods
      • Pre-built KPI dashboards adapted to your business model
      • Industry benchmarks help you identify anomalies quickly
    1. Real-Time Alerts
      • Flag when a location’s profitability drops below target
      • Alert you to unusual spending patterns (e.g., Location 1 labor costs suddenly up 20%)
      • Highlight opportunities (e.g., Location 3 has excess cash, Location 2 needs attention)
    1. Actionable Recommendations
      • “Location 2’s profitability is trending negative due to [specific reason]. Here’s the action plan…”
      • Automatic task generation for management team
      • Clear implementation steps with expected outcomes
    1. Mobile Access
      • Check financial health across all locations via WhatsApp or mobile app
      • Get answers to questions like “What’s our cash position across all stores?” instantly
      • Share real-time dashboards with location managers and lenders

    Real-World Example: How a 5-Location Fitness Chain Got Visibility Back

    The Situation:
    Sarah owned 5 fitness studios across a metro area. Each had its own POS system, accounting setup, and management style. She spent 15+ hours every week consolidating data from all locations into a master spreadsheet. By the time she had the full picture, it was already 10 days old.

    The Problem:

    • Studio 3 was struggling profitability-wise, but Sarah couldn’t pinpoint why
    • She didn’t know if it was too many staff members, low member acquisition, or high churn
    • Marketing budget was allocated equally across all studios—clearly wrong, but she had no data to prove it
    • She had no idea which classes were most profitable
    • Expansion to a 6th studio felt impossible given how overwhelmed she already was

    The Solution:
    Sarah implemented Miivo and connected all 5 studios’ data sources. Within 48 hours:

    Findings:

    1. Studio 3’s problem identified: 28% labor cost vs. 22% at other studios. Investigation revealed over-scheduling during off-peak hours.
    2. Marketing inefficiency discovered: Studio 1 had 40% higher member acquisition cost than Studio 4, despite same market. Different acquisition channels had vastly different efficiency.
    3. Class profitability analyzed: High-attendance classes (yoga, HIIT) had different per-member economics than niche classes. She could optimize scheduling accordingly.
    4. Cash position clarity: Studios 1 and 2 had excess cash; Studios 3 and 4 were tight. She could reallocate working capital more efficiently.

    Results:

    • Reduced weekly consolidation work from 15 hours to 1 hour
    • Fixed Studio 3’s labor scheduling, recovering $3,000/month profitability
    • Optimized marketing spend allocation by channel, improving member acquisition by 18%
    • Expanded to 6th studio with confidence (had the systems and visibility to manage it)
    • Promoted Studio 1 manager to regional operations (she had the data to identify the best performer)

    MRR Impact: +$8,500 from operational improvements alone

    How to Consolidate Your Financial Data: Implementation Roadmap

    Step 1: Audit Your Current Data Sources (Week 1)

    Document all systems generating financial data:

    • POS Systems: Square, Toast, Lightspeed, custom?
    • Accounting: QuickBooks Online, Xero, custom?
    • Payments: Stripe, Square, PayPal?
    • Inventory: Dedicated system or within accounting software?
    • Banking: Single master account or separate accounts per location?

    Deliverable: List of 10-15 data sources and their current integration status

    Step 2: Choose Your Consolidation Platform (Week 2)

    Evaluate options:

    • Dedicated multi-location BI tools: Tableau, Power BI, Looker (expensive, complex)
    • Accounting software add-ons: Spotlight Reporting, Fathom (limited scope, still requires integration work)
    • AI-powered SME advisors: Miivo (consolidation + insights + automation)

    Key Criteria:

    • Supports all your data sources
    • Real-time data refresh (not daily or monthly)
    • Location-level drill-down capability
    • Pre-built SME/retail dashboards (don’t want to build from scratch)
    • Mobile and web access
    • Customer support for implementation

    Step 3: Implementation (Weeks 3-4)

    1. Connect data sources: Authorize each system, set up API connections or direct integrations
    2. Configure location hierarchies: Define how locations map in the platform
    3. Standardize metrics: Ensure consistent definitions across locations
    4. Build dashboards: Customize views for CEO, location managers, finance team

    Step 4: Train Your Team (Week 4)

    • Finance team on data governance and updates
    • Location managers on accessing location-level performance data
    • Leadership on interpreting dashboards and making decisions

    Step 5: Optimize & Scale (Ongoing)

    • Review dashboards weekly to validate accuracy
    • Adjust metrics based on what matters most
    • Add new locations easily (no rebuilding required)

    Comparing Consolidation Approaches

    ApproachTime to ConsolidateData CurrencyCostScalabilityInsights
    Manual Spreadsheets7-10 daysStale$500-$2,000/mo labor✗ Breaks at 5+ locationsNone—just data
    BI Tools (Tableau, Power BI)2-3 days1 day lag$500-$3,000/mo + implementation✓ Scales but requires expertiseLimited—you build queries
    Accounting Add-ons3-5 daysOvernight$100-$500/mo✓ Limited to accounting dataReporting only
    Miivo AI AdvisorReal-timeCurrent to yesterday$399/mo✓ Scales effortlesslyActionable insights + recommendations

    The ROI of Consolidation

    Conservative Estimate (3 Locations, $3M Annual Revenue)

    Current State Costs:

    • Labor: $750/mo = $9,000/year
    • Duplicate software: $200/mo = $2,400/year
    • Missed opportunities (conservative): $5,000/mo = $60,000/year
    • Total annual cost: $71,400

    With Consolidation (Miivo at $399/mo):

    • Labor: $0 (automated) = $0
    • Software: $399/mo = $4,788/year
    • Operational improvements (margin recovery, optimization): $2,000/mo = $24,000/year
    • Net savings: ~$42,612/year

    ROI: 1,177% annual return (saves ~$42,600 vs. costs $4,800)

    Payback period: Less than 2 weeks

    Realistic Scenario (5 Locations, $10M Annual Revenue)

    Current State Costs:

    • Labor: $2,000/mo = $24,000/year
    • Duplicate software: $500/mo = $6,000/year
    • Missed opportunities (conservative): $8,000/mo = $96,000/year
    • Total annual cost: $126,000

    With Consolidation:

    • Labor: $0 (automated) = $0
    • Software: $399/mo = $4,788/year
    • Operational improvements: $4,000/mo = $48,000/year
    • Net savings: ~$121,212/year

    ROI: 2,533% annual return

    Payback period: Less than 1 week

    Why Multi-Location Businesses Choose Miivo

    Miivo goes beyond consolidation—it provides strategic insight:

    1. Automated Consolidation

      No more manual spreadsheet work. Connect once, get real-time consolidated view forever.
    2. Location-Level Intelligence

      Drill down to understand what’s driving profitability (or losses) at each location.
    3. AI-Powered Recommendations

      “Your Boston location is trending negative due to labor cost spike. Here’s the fix…”
    4. Location Manager Empowerment

      Managers see their location’s metrics compared to peers, driving healthy competition and accountability.
    5. Scaling Made Easy

      Add new locations to your dashboard in minutes. Same consolidation magic applies immediately.
    6. Mobile & Chat-Based

      Check on your business via WhatsApp or mobile app anytime, anywhere.

    Checklist: Is Your Multi-Location Business Ready for Consolidation?

    ☐ You spend >5 hours/week consolidating financial data across locations

    ☐ Your financial reports are 5+ days behind current operations

    ☐ You don’t have location-level profitability visibility

    ☐ Different locations report using different metrics or accounting methods

    ☐ You have 3+ locations and plan to expand further

    ☐ Growth is being constrained by inability to manage multiple locations effectively

    ☐ You want to empower location managers with performance data

    Score: If you checked 4+, consolidation should be your immediate priority.

    The Path Forward: Taking Action This Week

    Day 1: List all your data sources and current pain points
    Day 2: Schedule a demo with Miivo to explore your specific use case
    Day 3: Evaluate the implementation timeline and cost
    Day 4: Make the decision and begin implementation
    Week 2: Connected systems and initial dashboard setup
    Week 3: Train your team
    Week 4: Start making data-driven decisions across all locations

    Most multi-location businesses see ROI within the first month.

    Conclusion: From Chaos to Clarity

    Financial data chaos isn’t just annoying—it costs you tens of thousands of dollars annually in lost labor, missed opportunities, and suboptimal decisions.

    The solution isn’t hiring more finance staff. It’s implementing modern financial consolidation and intelligence tools that automatically pull your data together, identify insights, and recommend actions.

    With Miivo, you can go from drowning in spreadsheets to having real-time, location-level financial visibility in days. You’ll spend less time consolidating and more time strategizing. You’ll make faster, better-informed decisions. And you’ll unlock significant profitability improvements and scalability.

    The question isn’t whether you can afford to consolidate your financial data. It’s whether you can afford not to.

  • Why 82% of Small Businesses Fail Due to Cash Flow Issues (And How to Avoid It)

    Why 82% of Small Businesses Fail Due to Cash Flow Issues (And How to Avoid It)

    If you’re a small business owner, you’ve probably heard the sobering statistic: 82% of small businesses fail because of cash flow problems. But what does that actually mean for your business? And more importantly, how do you make sure you’re not part of that statistic? Effective cash flow management for a small business isn’t just about having money in the bank. It’s about timing, visibility, and control three things most SME owners struggle with daily. According to a 2025 study by the Federal Reserve, 60% of small businesses face cash flow gaps between paying suppliers and receiving customer payments, creating a constant cycle of financial stress.

    In this guide, we’ll break down why cash flow kills businesses, reveal the hidden warning signs you might be missing, and show you practical, actionable steps to take control without needing a finance degree or hiring a CFO.

    The Brutal Truth: Why Cash Flow Management Is Make-or-Break for SMEs

    Understanding the 82% Statistic

    Let’s get real for a moment. When we say “82% of businesses fail due to cash flow issues,” we’re not talking about businesses that ran out of customers or had bad products. We’re talking about profitable businesses that simply ran out of cash at the wrong time.

    Here’s how it typically plays out:

    • Month 1: You land a big client. Exciting! They agree to Net-60 payment terms (payment within 60 days).
    • Month 2: You need to pay your suppliers, employees, and rent. Your bank account balance: $12,000. Your expenses: $15,000. You dip into savings or use a credit card.
    • Month 3: The client still hasn’t paid (they’re at 45 days). Your next batch of expenses is due. You’re now $8,000 short. Panic sets in.
    • Month 4: By the time the client pays (at 75 days, not 60), you’ve already missed supplier payments, damaged vendor relationships, and paid late fees. Your stress is through the roof.

    This is cash flow failure and it happens to businesses making money on paper.

    The Three Hidden Killers

    According to CRISIL’s SME Financial Health Report 2025, there are three primary reasons SMEs face cash flow catastrophes:

    1. Delayed Customer Payments (Cited by 68% of SMEs)

    Research shows that the average SME waits 42 days past the invoice date to receive payment but expenses don’t wait.

    A retail distributor in Phoenix reported losing a $18,000 opportunity because they couldn’t afford to purchase inventory while waiting for customer payments.

    2. Inaccurate Cash Flow Forecasting (Cited by 54% of SMEs)

    Most SMEs don’t forecast cash flow beyond 30 days. Only 52% of UK SMEs regularly produce cash flow forecasts, meaning they’re flying blind into financial turbulence.

    The Problem: You might have  $20,000 today, but if you have $35,000 in expenses next week and only $5,000 in expected receivables, you’re in trouble and you won’t see it coming.

    3. Lack of Real-Time Financial Visibility (Cited by 61% of SMEs)

    Here’s where it gets painful: 61% of SMEs don’t have a clear, real-time view of their cash position. Financial data is spread across bank accounts, accounting software, spreadsheets, and the bookkeeper’s email.

    The Warning Signs You’re Heading Toward Cash Flow Crisis

    Self-Audit: Are You at Risk?

    Answer these questions honestly:

    • Do you check your bank balance multiple times per day with anxiety?
    • Have you delayed paying a supplier to make payroll in the last 6 months?
    • Are you using personal funds or credit cards to cover business expenses regularly?
    • Do you struggle to answer “What’s our cash position 30 days from now?”

    If you checked 2+ boxes, you’re experiencing cash flow stress. If you checked 4+, you’re in a high-risk zone.

    The Numbers Don’t Lie: Early Warning Indicators

    Goldman Sachs’ 10,000 Small Businesses research identified these financial red flags:

    Warning SignWhat It MeansRisk Level
    Days Sales Outstanding (DSO) >45 daysCustomers paying too slowlyHIGH
    Current Ratio <1.5Not enough liquid assets to cover short-term liabilitiesHIGH
    Operating Cash Flow negative 2+ consecutive monthsBurning more cash than generatingCRITICAL
    Cash Conversion Cycle >60 daysToo long between spending and collectingMEDIUM-HIGH
    Emergency Cash Reserve <2 months expensesNo buffer for disruptionsCRITICAL

    Stat Alert – According to Money Advice Trust research, 29% of SMEs cite cash flow worries as a barrier to growth, and 33% regularly lose sleep worrying about business finances.

    The Root Cause: Why SMEs Struggle with Cash Flow

    It’s Not About Revenue, It’s About Timing

    Here’s a paradox: You can have a profitable month and still run out of cash.

    Example: Revenue: $50,000 (on paper) | Expenses: $35,000 (paid immediately) | Profit: $15,000.

    BUT: If that $50,000 revenue is tied up in unpaid invoices for 60 days, and you need to pay $35,000 today, you’re short $35,000 in cash. This is the timing trap.

    The Manual Reporting Trap

    A 2025 study by the University of Gloucestershire found that SMEs using manual financial processes experience:

    • 15-20% lost productivity due to data entry time
    • 12% higher error rates in financial reporting
    • 3-week delay in identifying cash flow issues

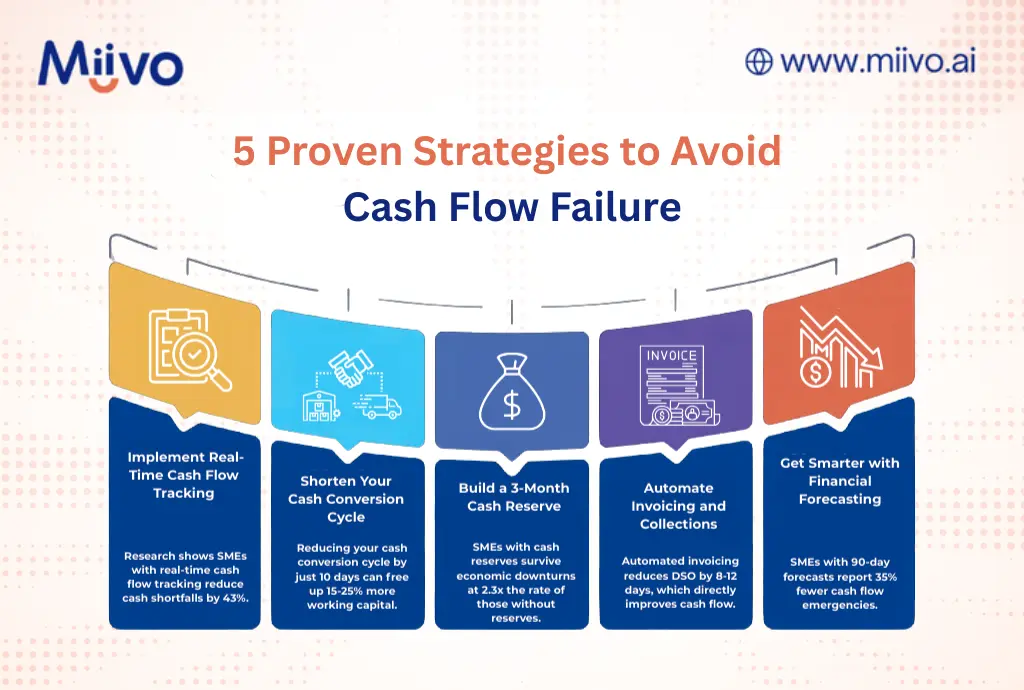
    The Solution: 5 Proven Strategies to Avoid Cash Flow Failure

    Strategy #1: Implement Real-Time Cash Flow Tracking

    The Problem: You’re looking at last month’s numbers to make today’s decisions.

    The Solution: Instead of relying on bank balances alone, use real-time operational and accounting data to understand your true cash position.

    Miivo centralizes your accounting, invoicing, receivables, payables, and operational data into a single, continuously updated view, so you can see where cash is coming from, going to, and getting stuck before it becomes a crisis.

    Outcome: Research shows SMEs with real-time tracking reduce cash shortfalls by 43%.

    strategies to avoid cash flow failures

    Strategy #2: Shorten Your Cash Conversion Cycle

    The Problem: Your money is stuck in the business cycle (inventory → sales → receivables) for too long.

    The Solution: Accelerate each stage of the cycle.

    Action Steps:

    For Inventory-Based Businesses:

    • Negotiate shorter supplier payment terms (e.g., Net-45 → Net-30)
    • Offer early payment discounts to customers (2% discount for payment within 10 days)
    • Implement just-in-time inventory to reduce cash tied up in stock

    For Service-Based Businesses:

    • Invoice immediately upon project milestone completion (don’t wait until end)
    • Require 50% upfront payment for projects >$10,000
    • Use payment plans with auto-debit for retainer clients

    Expected Outcome: Reducing your cash conversion cycle by just 10 days can free up 15-25% more working capital.

    Strategy #3: Build a 3-Month Cash Reserve

    The Problem: One unexpected expense (equipment breakdown, late client payment) derails your entire month.

    The Solution: Establish an emergency cash reserve equal to 3 months of operating expenses.

    Action Steps:

    1. Calculate average monthly operating expenses (exclude one-time costs)
    2. Set a goal: 3x monthly expenses (e.g., $15,000/month → $45,000 reserve)
    3. Automate savings: Transfer 5-10% of monthly revenue to reserve account
    4. Use reserve only for genuine emergencies (not growth investments)

    Reality Check: This won’t happen overnight. Goldman Sachs research shows it takes 8-12 months for most SMEs to build a 3-month reserve, but even starting with 1 month provides critical protection.

    Stat: SMEs with cash reserves survive economic downturns at 2.3x the rate of those without reserves.

    Strategy #4: Automate Invoicing and Collections

    The Problem: Manual invoicing delays payment by 7-14 days on average.

    The Solution: Automated invoicing systems with payment reminders and one-click payment options.

    Action Steps:

    1. Use invoicing software that auto-generates invoices upon project completion
    2. Enable one-click payment (credit card, ACH, PayPal)
    3. Set up automated payment reminders (Day 7, 15, 25, 35)
    4. Offer incentives for early payment (1-2% discount)
    5. Implement late fees (after 30 days) to encourage timely payment

    Expected Outcome: Automated invoicing reduces DSO (Days Sales Outstanding) by 8-12 days, which directly improves cash flow.

    Strategy #5: Get Smarter with Financial Forecasting

    The Problem: You don’t know what your cash position will be 30, 60, 90 days from now.

    The Solution: Rolling 90-day cash flow forecast updated weekly.

    Action Steps:

    1. Week 1: List all expected cash inflows (customer payments, new sales)
    2. Week 1: List all expected cash outflows (payroll, rent, suppliers, taxes)
    3. Week 2: Create a simple spreadsheet or use Miivo’s forecasting tool
    4. Ongoing: Update forecast every Monday with actual vs. expected
    5. Red Flag Protocol: If forecast shows cash shortfall in next 30 days, trigger action plan (delay non-essential expenses, accelerate collections, access line of credit)

    Pro Tip: Use conservative estimates. Better to be pleasantly surprised than caught short.

    Expected Outcome: SMEs with 90-day forecasts report 35% fewer cash flow emergencies.

    Here are some additional tips for cash flow management for small businesses growth.

    How Technology Is Solving the Cash Flow Crisis

    The Rise of Real-Time Business Intelligence for SMEs

    Here’s the good news: Technology has finally caught up to SME needs.

    A decade ago, business intelligence (BI) tools cost $50,000+ and required IT teams. Today, platforms like Miivo offer:

    • Real-time cash flow tracking across multiple bank accounts and locations
    • Automated financial health scores (know your status in 60 seconds)
    • Industry benchmarking (see how your cash flow compares to peers)
    • WhatsApp alerts (get notified when cash drops below threshold no need to log into dashboards)
    • Plain-English insights (“You have 23 days of cash runway” vs. complex spreadsheets)

    Stat: According to Salesforce’s 2025 Small Business Intelligence Report, SMEs using BI tools experience:

    • 32% boost in productivity
    • 26% reduction in analysis time
    • 33% increase in insights-driven decisions

    Real-World Success Story

    Case Study: Phoenix Retail Distributor (Name Anonymized)

    Background: 5-location retail distribution business, $1M annual revenue, 35 employees.

    Problem: Frequent cash flow gaps due to delayed customer payments. Used spreadsheets to track finances across 5 locations. Spent 12+ hours/week manually consolidating data.

    Solution: Implemented Miivo in January 2025.

    Results After 90 Days:

    • Reduced manual reporting time: 12 hours/week → 1 hour/week (92% reduction)
    • Improved DSO: 58 days → 42 days (accelerated collections by 16 days)
    • Cash flow visibility: Real-time vs. 2-week lag
    • Identified issue: One location was underperforming by 35% wouldn’t have known without consolidated view
    • ROI:  $21,600 in freed-up working capital in first 90 days

    Founder Quote: “For the first time in 8 years, I’m not stressed about making payroll. I know exactly where we stand at any moment.”

    Taking Action: Your 30-Day Cash Flow Turnaround Plan

    Week 1: Assess Your Current State

    •  Calculate your current cash position
    •  Calculate Days Sales Outstanding (DSO)
    •  List all outstanding invoices >30 days
    •  Review cash flow for last 90 days (identify patterns)

    Week 2: Implement Quick Wins

    •  Follow up on all invoices >30 days (call, don’t just email)
    •  Set up automated invoicing for future projects
    •  Negotiate extended payment terms with 2-3 key suppliers

    Week 3: Build Your System

    •  Connect bank accounts and accounting software to BI platform
    •  Create 90-day cash flow forecast
    •  Set up weekly cash position review (every Monday 9 AM)

    Week 4: Establish Safeguards

    •  Set up low-cash alerts (when balance drops below 30 days expenses)
    •  Start building emergency reserve (even if it’s $500/month)
    •  Document your cash flow management process (so it’s repeatable)

    Conclusion: You Don’t Have to Be Part of the 82%

    Cash flow failure isn’t inevitable. It’s preventable but only if you treat it with the urgency it deserves.

    The bottom line: You can’t manage what you can’t see. And in 2025, there’s no excuse for flying blind on your business finances.

    Whether you use Miivo, build your own systems, or hire a part-time CFO, the key is this: Real-time visibility + proactive management = cash flow control.

    Don’t wait until you’re staring at a $0 bank balance and wondering where it went wrong. Start today.

    Want to See Where You Stand?

    Get your free business health score in 60 seconds. Connect your accounts to Miivo and see your cash runway, industry benchmarks, and personalized recommendations no credit card required.

    Start Free Health Check

    Suggested for You

  • Smarter Planning Tools for Small Businesses

    Most small business owners create a business plan and they rarely look at it again. However, using AI business planning for small business can transform the way owners approach and use their plans.

    📉 A static plan is a dead plan.

    In today’s fast-changing economy, your plan needs to evolve constantly. The most resilient businesses treat planning as a living, breathing system, not a document that gathers digital dust. In fact, AI business planning for small business makes adapting much easier.

    Why Static Business Planning Doesn’t Work
    Traditional business plans get outdated quickly. Customer behaviour shifts. Market trends evolve. New competitors enter the scene.

    Without updates, your plan becomes irrelevant. That puts you at risk of:

    • Making decisions based on old data
    • Missing growth opportunities
    • Losing control of cash flow
    • Falling behind competitors

    What Agile Businesses Do Differently?

    High-performing businesses use dynamic business planning. Here’s what that looks like:

    • Regularly review actual results vs. forecasts
    • Update assumptions based on real-time performance
    • Quick strategy adjustment with change in conditions

    Historically, this approach required expensive software or a dedicated finance team. Today, AI advisor tools like Miivo make it accessible to small businesses. Moreover, these tools represent a new era of AI business planning for small business owners.

    How Miivo Supports Small Businesses Plan Smarter?

    Instead of relying on clunky spreadsheets, Miivo provides an AI-powered platform that empowers businesses to:

    • Replace static spreadsheets
    • Get real-time visibility into business performance
    • Forecast smarter using live data
    • Create an action plan when things go off track

    🧠 Real-Time Insights
    No more waiting for monthly reports. Once integrated, the platform connects to your systems and displays real-time business insights.

    📈 AI-Powered Forecasting
    Miivo doesn’t just track performance, it evaluates your numbers against goals or benchmarks. This means you always have an up-to-date, realistic outlook, thanks to our AI advisor tool.

    🔔 Smart Action Plan
    When something’s off, Miivo suggests what to do next. It not only identifies the main opportunity but also breaks it into manageable sub-tasks. That way, you can take action with confidence. Furthermore, AI business planning for small business enables owners to respond to changes more rapidly.

    Smart goals for smart companies

    Why Miivo Is Different?

    Most tools show you what happened. Instead, Miivo helps you decide what to do next.

    Miivo simplifies everything:

    • A simple, intuitive dashboard
    • No corporate jargon
    • No need for a finance degree

    Regardless of your size, whether you’re a solopreneur or managing a growing team, Miivo gives you a strategic edge, minus the complexity. To summarise, AI business planning for small business empowers owners to keep their plans both relevant and actionable.

    Your Business Plan Should Evolve. Just Like Your Business.
    Business conditions change and sales pipelines shift. Plus, your goals also evolve over time. Given all that, why stick with a frozen plan?

    With Miivo, your planning process becomes:

    • Continuous
    • Adaptive
    • Actionable

    To conclude, you stay focused on what really matters: sustainable growth.

    Ready to act? Start Your Free Trial Today, No Credit Card Required.

  • Why Cash Flow Matters: A Complete Guide for Small Businesses

    Did you know that 82% of small businesses fail due to cash flow problems? Effective cash flow management is essential for keeping your business healthy and avoiding common pitfalls.

    Not because they lack customers.
    Not because their product is bad.

    But because they run out of cash.

    Cash flow is the lifeblood of your business. It keeps operations running, supports growth, and ensures financial stability. Without it, even profitable businesses can collapse.

    Let’s break down why cash flow matters and how you can manage it effectively.

    What Is Cash Flow?

    Cash flow is the movement of money in and out of your business.

    • Positive cash flow = You bring in more money than you spend.
    • Negative cash flow = You spend more than you earn.

    Positive cash flow gives you freedom. Negative cash flow creates stress.

    Understanding your cash position helps you make smarter decisions about hiring, investing, and scaling.

    Key cash flow tips:

    1. Track income & expenses: Use a cash flow statement to monitor daily operations, investments, and funding.
    2. Get paid faster: Offer early payment discounts and set clear terms.
    3. Cut costs smartly: Eliminate unused subscriptions and renegotiate contracts.
    4. Use tools: Software like Miivo simplifies cash flow tracking.

    Quick Action Steps:

    • Send invoices promptly.
    • Build a 3–6 month cash reserve.
    • Forecast cash flow for the next 3–12 months.

    Remember: Positive cash flow means bringing in more money than you spend – essential for long-term success.

    How businesses manage money | Cash Flow explained

    Cash Flow Statement Parts

    A cash flow statement reveals where your money comes from and how it’s spent. Let’s break down its three main sections to give you a clearer picture of your business finances.

    Daily Business Income and Expenses

    This part, called operating activities, tracks your everyday income and expenses. It’s the foundation of your business’s financial well-being.

    Most of your cash should ideally come from operating activities. As QuickBooks expert Kat Boogaard explains, “Cash flow is the movement of money in and out of your business bank account. Understanding where your cash is coming from and where it’s going is key for decision-making.”

    Some examples of operating activities include:

    • Revenue from sales and services
    • Employee wages and salaries
    • Inventory purchases
    • Rent and utilities
    • Tax payments

    Why does this matter? Recent data highlights the importance: 25% of small businesses waited a year or more to get paid (or never got paid), and 70% faced delays of one to six months.

    Equipment and Property Purchases

    Investing activities focus on big-ticket items and long-term assets. This section records cash spent or received for:

    • Buildings and land
    • Vehicles
    • Office equipment
    • Manufacturing machinery
    • Investment securities

    For instance, buying a new delivery truck for $45,000 would show as a negative cash flow. On the other hand, selling old equipment for $10,000 would appear as a positive cash flow.

    Loans and Business Funding

    The financing activities section highlights how your business secures funding from external sources. This includes:

    • Bank loans
    • Credit lines
    • Investor funding
    • Dividend payments
    • Debt repayment

    Here’s an example of how these three components work together:

    ComponentTransactionImpact
    OperatingMonthly sales revenue: $50,000Positive
    InvestingNew equipment purchase: -$20,000Negative
    FinancingBank loan received: $30,000Positive

    While financing activities can provide much-needed cash, relying too heavily on loans or investors isn’t a sustainable strategy. The ultimate goal is to generate enough cash from operating activities to fuel your business growth.

    Cash Flow Management Methods

    Managing cash flow effectively means balancing two key objectives: speeding up your incoming payments and controlling expenses. Let’s explore practical ways to achieve both.

    Getting Paid Faster

    Late payments can disrupt your operations, and addressing this issue could improve your revenue by about $31,000 on average.

    Here are some tips to collect payments more efficiently:

    • Set Clear Payment TermsClearly outline due dates, payment methods, and penalties for late payments in your contracts.
    • Streamline Your Invoicing ProcessErrors in invoices often lead to delays. The following strategies can help:
    StrategyHow to Apply It
    Early Payment DiscountsOffer discounts for early payments and include terms directly on the invoice.
    Late Payment FeesSpecify penalties for late payments in your contracts and reminders.
    Upfront DepositsCollect substantial deposits (50–70%) before starting a project.
    Multiple Payment OptionsAccept a variety of payment methods – credit cards, ACH, and digital payments – to make it easier for clients to pay.

    “It’s the squeaky wheel that gets the oil, so make sure you take an active role in approaching businesses that owe you money. Be firm, but fair.”
    – Ben Richmond, U.S. Country Manager, Xero

    Once you’ve improved your payment collection process, you can turn your attention to cutting costs.

    Reducing Business Expenses

    Smart cost management involves lowering expenses without sacrificing quality. Here are some ways to do it:

    • Vendor ManagementReview your suppliers and consolidate where possible to gain better pricing. Negotiating contracts can save up to 9.2% on total contract value.
    • Technology OptimizationMany businesses waste money on unused software. In fact, unused SaaS licenses can cost up to $18 million annually.

    “With completely integrated spend management and travel, we were able to cut T&E costs by 50% with only a 15% reduction in travel.”
    – Teddy Collins, Vice President of Finance, SeatGeek

    • Operational EfficiencyImprove efficiency with these steps:
      • Shift to remote work to reduce office expenses
      • Automate repetitive tasks
      • Consolidate insurance policies
      • Renegotiate loan terms
      • Switch to paperless systems

    “The key is…to cut strategically. Look at what drives the most value for your business and protect those areas.”
    – Chidiebere Ogbonnaya, Professor in Human Resource Management, King’s College London

    Cash Flow Software and Apps

    Once you’ve explored ways to improve cash flow, the next logical step is using technology to streamline your financial tracking. Modern tools make managing cash flow much easier.

    Miivo uses AI to help small businesses manage their cash flow more effectively. Its features include:

    • Real-time analysis with actionable insights
    • AI-driven recommendations for growth
    • Secure financial data handling

    Connecting with Accounting Software

    Integrating your accounting software ensures accurate cash flow tracking, providing a clear view of:

    • Current cash movements
    • Outstanding balances
    • Remaining budgets
    • Updated payment dates for bills and invoices

    When choosing tools, look for features like:

    • A simple, user-friendly interface
    • Real-time data syncing
    • Error detection
    • An audit trail

    A study found that 84% of small-business owners believe using a single platform would save time. Meanwhile, around 60% of small businesses currently rely on two to three cash flow tools. Integrated platforms make managing finances even easier.

    Summary

    The sections above explored the essentials of cash flow and strategies for managing it effectively. Here’s a quick recap: around 82% of small businesses fail due to cash flow problems.

    Key Takeaways

    ComponentKey ActionsImpact
    Income ManagementSend invoices promptly and offer early payment discountsSpeeds up cash inflows
    Expense ControlEliminate unneeded subscriptions; lease instead of buyingCuts cash outflows
    Cash ReservesKeep 3–6 months of operating costs in reserveProvides financial stability
    TechnologyUse specialized software to track cash flowBoosts accuracy

    “Never take your eyes off the cash flow because it’s the lifeblood of your business.”
    – Richard Branson, Founder of the Virgin Group

    These elements are the foundation for making meaningful changes.

    Immediate Steps to Take

    • Automate invoicing and set up payment reminders
    • Audit and reduce monthly expenses
    • Create cash flow forecasts for the next 3–12 months
    • Establish clear payment terms for clients

    Long-Term Goals

    • Build a reserve fund to cover 3–6 months of operating expenses
    • Invest in cash flow management software
    • Renegotiate payment terms with suppliers
    • Explore leasing options for equipment instead of purchasing outright

    “If you’re a small business owner, it’s vital to understand your current cash position, and to know how to keep cash flowing so the heart of your business keeps beating.”
    – Ben Richmond, U.S. Country Manager for Xero

    “Business owners are often, by necessity, very focused on what’s happening here and now, but they also need to plan ahead.”
    – Chris Wong, Head of Small Business Products with Bank of America.

    Suggested for You

  • 6 Ways AI Can Improve Business Financial Planning

    AI for business financial planning is a game changer for organisations of all sizes. AI is transforming financial planning, making processes faster, more accurate, and efficient. Here’s how businesses, especially small and medium-sized enterprises (SMEs), can benefit:

    • Financial Forecasting: AI reduces forecasting errors by 30%, enabling better revenue predictions and budget planning.
    • Expense Management: Automates tasks like receipt processing and fraud detection, saving time and cutting costs.
    • Cash Flow Control: Improves cash flow forecasts by 50%, helping businesses manage liquidity and avoid financial pitfalls.
    • Risk Management: Detects credit risks, fraud, and compliance issues using advanced algorithms.
    • Custom Analysis: Converts complex data into clear visuals for better decision-making and growth planning.
    • Scenario Testing: Simulates financial outcomes to prepare for market changes and optimize strategies.

    AI tools are helping businesses save time, reduce errors, and make smarter financial decisions. Whether you’re managing cash flow or planning growth, AI can simplify and enhance your financial operations.

    Best Automated Financial Modeling & Cash Flow Forecasting Software

    1. Financial Forecasting with AI

    Machine learning is transforming financial forecasting. Studies reveal that machine learning models reduce forecasting errors by about 30% compared to older methods. In 2024, 58% of finance teams used AI, a sharp rise of 21% from 2023. This shift is enabling more in-depth data analysis.

    Pattern Detection in Financial Data

    AI excels at analyzing historical data, market trends, and payment patterns to find insights that might otherwise go unnoticed. For example, Siemens introduced advanced AI models for financial reporting, using interactive dashboards that improved prediction accuracy by 10%. Another case involved a global tech firm working with Coherent Solutions to streamline its forecasting process. By using AI to analyze key performance indicators, the company reduced its forecasting timeline from weeks to just a few days.

    “Our finance team spends 40% less time on forecasting with AI, freeing up resources for key business decisions.”
    – Chunyang Shen, co-founder of Jarsy Inc.

    Better Budget Planning

    Traditional spreadsheets are notorious for errors – over 90% contain mistakes. AI-powered Financial Planning & Analysis tools, on the other hand, offer more precise and frequent forecasts. With better pattern recognition, AI helps identify potential discrepancies, making budget planning more reliable. Here’s a snapshot of how AI improves budgeting:

    Improvement AreaAI Impact
    Revenue ForecastingNearly 60% of companies saw revenue growth, with 10% reporting over 10% growth
    Cost Reduction31% of companies cut costs, with 7% reducing expenses by more than 10%
    Processing Time40% faster forecast preparation
    Error PreventionAutomated data checks and anomaly detection

    “Begin with a targeted financial aspect where AI delivers immediate value.”
    – Marin Cristian-Ovidiu, CEO of Online Games.

    2. Smart Expense Management

    AI is revolutionizing how businesses handle expense tracking and reporting. Traditionally, finance teams spend over half their time on manual tasks, but AI tools are reshaping this process.

    Live Expense Tracking

    AI-powered systems now offer 93% accuracy in categorizing expenses. Using advanced OCR (Optical Character Recognition) and machine learning, these tools can instantly process receipts and analyze spending patterns in real time.

    FeatureTraditional MethodAI-Powered Solution
    Receipt ProcessingManual data entryInstant OCR scanning
    Expense ClassificationManual categorizationAutomated with 93% accuracy
    Policy ComplianceManual checkingReal-time verification
    Fraud DetectionPeriodic reviewContinuous monitoring

    Reducing Manual Work

    AI goes beyond live tracking to simplify the entire expense management process. By automating workflows, it minimizes human errors and ensures consistent reporting. For instance, a construction company using Fyle cut policy violations by 40% and halved reimbursement processing time.

    Other success stories include:

    • A marketing agency improving reporting accuracy by 30% while reducing processing time by 25%.
    • A consulting firm lowering fraud cases by 40% and increasing compliance by 50%.
    • A startup saving 20 hours per month and cutting expenses by 30%.

    These improvements don’t just save money – they also make financial planning more reliable. 

    AI also identifies spending trends, flags unusual activity, and ensures policy compliance in real time. This proactive approach helps businesses stay in control of their finances while freeing up resources for more strategic priorities.

    3. Cash Flow Control

    AI is changing the way businesses handle and predict cash flow. Modern AI systems can cut forecasting errors by up to 50% compared to older methods, helping companies maintain healthier cash reserves. Let’s take a closer look at how cash flow tools are making these improvements possible.

    Cash Flow Tools

    AI-powered cash flow management tools now offer advanced features that go well beyond basic accounting. By pulling data from multiple sources, these tools provide deeper insights. Here’s how they work:

    Data SourceWhat AI AnalyzesBusiness Impact
    ERP SystemsTransaction patternsMore accurate spending forecasts
    CRM PlatformsCustomer payment behaviorImproved receivables prediction
    Market DataEconomic indicatorsBetter risk management
    Social MediaMarket sentimentEarly trend identification

    These tools go beyond forecasting – they allow businesses to act quickly and avoid potential cash flow problems.

    Early Problem Detection

    AI doesn’t just improve forecasts; it also flags potential cash flow issues before they escalate. With cash flow problems being the reason 80% of small businesses fail, early detection is critical. AI systems excel at spotting these red flags early.

    Other examples include fintech companies identifying suspicious transfers, SaaS firms reducing overdue payments with proactive follow-ups, and retail businesses adjusting inventory based on slow-moving stock.

    The demand for AI-powered cash flow management tools is growing quickly. By 2031, the market is expected to hit $9.65 billion, with a compound annual growth rate (CAGR) of 16.34%. This growth reflects how businesses are increasingly relying on AI to ensure financial stability and avoid cash flow challenges.

    4. Financial Risk Management

    AI is changing the way businesses handle financial risks by processing data faster and more effectively than older methods. This gives companies a stronger grip on maintaining their financial stability.

    Risk Detection Systems

    AI-powered tools are reshaping how businesses monitor financial health. These systems analyze everything from market trends and news to social media chatter, uncovering risks that might otherwise go unnoticed. They also keep a close watch on internal operations and market conditions, helping companies identify potential threats.

    Here’s how AI is making an impact:

    • Credit Risk: AI evaluates customer payment habits and portfolio performance to flag potential credit issues.
    • Fraud Detection: By analyzing transaction patterns and merchant behavior, AI uncovers fraudulent activities.
    • Compliance Support: AI tracks regulatory changes and internal processes, ensuring companies stay compliant.

    The results speak for themselves. For example, insurance companies leveraging AI to spot fraudulent claims are tackling an industry problem that costs around $309 billion annually. In credit card fraud detection, machine learning models use vast amounts of historical data to make highly accurate predictions.

    But it doesn’t stop at detection – AI also helps businesses respond to risks more effectively.

    Risk Response Planning

    Once risks are identified, AI enables businesses to move from merely reacting to threats to proactively managing them. With AI, companies can craft strategies that not only reduce risks but also uncover opportunities for growth.

    The numbers back this up: The AI risk management market is projected to hit $7.4 billion by 2032, growing at a rate of 16.2% annually. Businesses using AI-driven strategies have reported impressive outcomes:

    • 45% Faster Case Resolution: Financial services saw a significant reduction in the time it takes to resolve cases.
    • Higher Revenue Growth: Companies with advanced AI systems achieved 50% more revenue growth compared to their competitors.
    • Fewer False Positives: AI has reduced false alarms in areas like anti-money laundering and fraud detection.

    To make the most of AI in risk management, businesses need to build internal expertise and set clear guidelines. This includes training staff on AI-related risks and establishing safeguards. The goal is to seamlessly integrate AI tools into existing risk management processes, improving decision-making while keeping human oversight in place.

    5. Custom Financial Analysis

    AI is revolutionizing financial analysis by turning complex data into clear, actionable insights. What once took teams weeks to compile can now be done quickly with personalized analysis.

    Financial Data Visualization

    AI-powered tools make sense of overwhelming financial data by converting it into easy-to-understand visuals. These tools highlight trends and patterns, helping businesses make informed decisions. With global data volumes projected to hit 180 trillion gigabytes by 2025, AI solutions are becoming a necessity for effective analysis.

    Clear visualization not only simplifies data but also sets the stage for smarter growth strategies.

    Growth Planning

    With clear visual insights, businesses can take advantage of AI to fine-tune growth planning. AI helps analyze trends, forecast outcomes, and gain competitive insights. Research shows that 50% of companies using AI for forecasting reduced errors by at least 20%, while 25% saw reductions of 50% or more.

    Here are two examples of AI’s impact on growth planning:

    • Purple (Mattress Company)
      • Cut invoice backlog by 50% in three months
      • Achieved a 63% faster invoice approval time
      • Eliminated duplicate payments
    • GRF CPAs & Advisors
      • Reduced workflow time by 40%
      • Anticipates 50–90% efficiency gains in the near future

    To get the most out of AI-driven financial analysis, businesses should focus on:

    • Competitive benchmarking
    • Using AI for dynamic pricing strategies
    • Creating real-time feedback systems
    • Consolidating financial data into a single, unified platform

    6. Financial Testing and Planning

    AI is transforming how businesses test and validate their financial choices. Modern AI tools can process massive datasets and simulate thousands of outcomes in just seconds. This helps companies prepare for a variety of market conditions with impressive precision.

    Multiple Scenario Testing

    AI-driven scenario testing allows businesses to simulate various financial situations by examining current market trends and historical data. This reduces human bias and equips companies to handle a range of market dynamics.

    One standout feature of AI scenario testing is its ability to evaluate multiple variables at once. For instance, Acme Solar Technologies (AST) used an AI solution to model three critical scenarios:

    • Government subsidy reductions: Revenue impacts ranging from 20–50% declines
    • Raw material cost changes: Production expense shifts of 10–30%
    • Consumer demand fluctuations: Revenue forecast variations of 15–40%

    These simulations revealed that the combination of reduced subsidies and rising material costs posed the greatest threat. In response, AST crafted a strategic plan that included:

    • Expanding their supply chain
    • Speeding up R&D to cut production costs
    • Entering commercial markets with less reliance on subsidies

    Decision Impact Analysis

    AI doesn’t stop at scenario testing – it also helps businesses understand the financial effects of their decisions. This is critical, given that 70% of C-suite executives and finance professionals have admitted to making major decisions based on flawed financial data.

    Here’s how AI improves decision impact analysis:

    Analysis StageAI’s Role
    Data PreparationCleans and organizes datasets
    Variable DefinitionIdentifies critical financial drivers
    Simulation ExecutionRuns advanced simulations and forecasts
    Results InterpretationPinpoints outcomes, risks, and solutions

    These insights lead to more precise, data-driven decisions.

    “AI-driven scenario analysis replaces static models with real-time insights, improving risk assessment and decision-making.” – CFI

    To get the most out of AI-powered financial testing:

    • Implement effective data management systems
    • Centralize financial data into one reliable source
    • Use AI tools with two-way data integration capabilities

    Modern platforms like Planful Predict are changing the game. According to their documentation:

    “Predict: Signals empowers users to take corrective action by surfacing variances and anomalies in data with AI-driven anomaly detection.”

    With global AI investment expected to hit nearly $200 billion by 2025, these tools will only become more advanced and accessible for businesses of all sizes.

    Conclusion

    AI is transforming finance with impressive results: 30% faster planning cycles, 20-40% more accurate forecasts, and improved financial productivity. These benefits make a strong case for integrating AI into your financial planning strategy.

    Getting Started with AI

    If you’re ready to move away from manual processes, here’s how to take the first steps toward automation. Focus on evaluating your current workflows, selecting the right tools, and starting small with impactful tasks:

    Implementation StageKey ActionsExpected Outcomes
    AssessmentAnalyze existing processes and capabilitiesSpot areas ripe for automation
    Tool SelectionPick AI tools that align with your systemsSmooth integration with minimal disruption
    ImplementationBegin with straightforward, high-impact tasksQuick results and proof of value
    OptimizationTrack performance and refine strategiesBoost accuracy and efficiency

    Miivo offers essential financial insights and advanced features like detailed cash flow analysis and actionable recommendations.

    “AI can make the SaaS Financial Planning & Analysis process faster and more accurate, allowing you to spend less time on manual tasks like data entry and building models, and more time on high value work such as analysis and strategy.” – Joe Garafalo, Founder and COO

    AI Financial Tools Outlook

    AI continues to revolutionize every phase of financial planning, paving the way for better decision-making and risk management. The U.S. AI industry is projected to hit $826.70 billion by 2030. As tools evolve, expect even greater advancements:

    • Customized Advice: Tools offering tailored financial guidance and budgeting solutions.
    • Real-time Risk Assessment: Ongoing market analysis and adaptive strategies.
    • Automated Compliance: Simplified regulatory reporting and issue detection.

    These advancements are especially impactful for small and medium-sized businesses. A staggering 97% of financial advisors predict AI will drive over 20% growth. With 91% of firms already using or considering AI, it’s clear that adopting these tools is no longer optional – it’s a competitive necessity.

    “With more profound accuracy and heightened efficiency, AI and machine learning are the messiahs of the business world, guiding small businesses through turbulent times one issue at a time.” – Escalon.

    Suggested for You

  • Business Decision-Making Guide: From Data to Action

    Here’s the key takeaway: Businesses that use data-driven strategies are more productive, efficient, and profitable. For example, data analysis can improve productivity by 5-6%, cut inventory costs by 15%, and boost sales by 10%.

    How to get started:

    • Organize Your Data: Collect and clean data from sales, customers, marketing, and operations.
    • Use AI Tools: Platforms like Miivo can turn raw data into actionable insights.
    • Make Data-Backed Decisions: Define clear goals, evaluate options, and use metrics to track results.
    • Refine Your Strategy: Regularly monitor KPIs and adjust based on performance.

    How to Leverage AI for Data-Driven Business Decisions

    Step 1: Getting Your Business Data Ready

    Before diving into analysis, it’s crucial to organize your data. Businesses that manage their data well are better equipped to make smart decisions and adapt to market shifts.

    Finding Your Data Sources

    Your business likely has several key data sources that can guide decision-making. Here are some of the most important ones to focus on:

    Data Source What to Track Why It Matters
    Sales Data Transaction history, revenue trends, product performance Highlights buying patterns and revenue potential
    Customer Information Demographics, purchase history, feedback Helps tailor offerings and boost retention
    Financial Records Cash flow, expenses, profit margins Supports better budget management
    Marketing Metrics Email campaigns, social media engagement, website traffic Measures the effectiveness of marketing efforts
    Operations Data Inventory levels, supply chain metrics, productivity rates Pinpoints areas to improve efficiency

    “Customer information is more than details or statistics about your customers. This information provides actionable insights into the unique preferences and needs of every individual who interacts with your brand.” – Mailchimp

    Did you know email marketing delivers an impressive $36 ROI for every $1 spent? With your data sources identified, the next step is organizing this information effectively.

    Data Organization Methods

    Here’s how to keep your data organized and accessible:

    1. Use Consistent File Naming
    Adopt a uniform naming system, such as: YYYY-MM-DD, project/category, version, and department.

    2. Create a Cloud Storage Structure
    Set up specific folders in your cloud storage for:

    • Financial Records
    • Customer Data
    • Marketing Analytics
    • Operations Metrics
    • Team Performance

    3. Maintain Data Quality

    • Regularly clean your data to eliminate duplicates
    • Update outdated details
    • Check for accuracy every quarter
    • Document where and how data is collected
    • Use a data dictionary to standardize terms

    4. Choose Tools That Fit Your Needs

    Pick tools that align with your business requirements and budget. Make sure they integrate seamlessly with your existing systems. Also, be upfront with customers about how you collect and use their data.

    Getting your data organized now will set the stage for effective AI analysis in the next steps.

    Step 2: Using AI to Analyze Your Data

    Once your data is organized, AI tools can help you turn it into actionable insights. These platforms make it easier for businesses, even those without technical expertise, to make informed decisions. One standout option is Miivo, an AI-powered platform designed for financial analysis and growth planning.

    Miivo: AI Business Analysis Tools

    Miivo simplifies complex financial data, offering clear insights that help small and medium-sized businesses (SMEs) make smarter decisions. Here’s how it supports businesses:

    Feature Business Impact Why It Matters
    Financial Analysis Monitors cash flow in real-time Helps with better planning
    Growth Planning Offers AI-based strategy suggestions Guides expansion decisions
    Profit Management Tracks expenses and revenue Boosts profit margins
    Secure Data Handling Processes data privately Keeps business info safe

    Plans start at $49/month for the Pro version. Larger businesses can opt for the Enterprise plan, which offers tailored solutions.

    What to Look for in AI Tools

    When choosing an AI platform, focus on these key factors:

    • Cost-effectiveness: Look for cloud-based tools with flexible, pay-as-you-go pricing.
    • Integration capabilities: Ensure the tool works smoothly with your current systems, reducing manual work and improving data flow.
    • User-friendly interface: Pick platforms that display data in an easy-to-understand way. Your team shouldn’t need advanced skills to use them.
    • Scalability: Choose tools that can grow alongside your business needs.

    The right AI platform can transform how you analyze and act on your business data, helping you make smarter, faster decisions.

    Step 3: Making Decisions Based on Data

    Creating Your Decision Process

    Once your data is sorted and AI has provided insights, it’s time to turn those insights into actionable steps. Here’s how to structure your decision-making process:

    • Define Your Objective: Set a clear, measurable goal. For instance, if you want to boost customer retention, aim for something specific like “increase retention rate by 15% in six months.”
    • Gather Relevant Data: Use tools like Miivo for detailed cash flow analysis and customized recommendations to guide your decisions.
    • Evaluate Your Options: Use a decision matrix to weigh potential solutions:
    Decision Factor Impact Level Cost Timeline Risk Level
    Expected Results High/Medium/Low $ Value Weeks/Months 1-5 Scale
    Resource Requirements Staff/Tools Budget Timeline Dependencies
    Success Metrics KPIs to Track ROI Measurement Period Monitoring Plan

    Solving Common Problems

    Small businesses often face hurdles when making data-driven decisions. Here’s how to tackle a few common issues:

    • Limited Resources:
      • Start with free analytics tools.
      • Focus on one key metric at a time.
      • Automate data collection wherever possible.
    • Data Quality Issues:
      • Establish basic data governance practices.
      • Conduct regular data audits.
      • Train employees on accurate data entry methods.

    Business Success Stories

    • Warby Parker: The eyewear brand uses analytics to streamline its supply chain and predict demand for various styles. This approach helps them manage inventory and refine products based on customer feedback.
    • Red Rabbit: Founder Rhys Powell analyzed cost and return data, shifting the company’s focus from parents to schools for meal delivery. This pivot allowed them to scale up to delivering over 20,000 meals daily to students.
    • Dollar Shave Club: By analyzing customer behavior and subscription trends, DSC fine-tunes its marketing efforts and personalizes product recommendations. This strategy has significantly improved customer retention.

    Data-driven businesses are 23 times more likely to acquire customers and 6 times more likely to retain them. Once decisions are made, the next step is tracking results and making adjustments as needed.

    Step 4: Tracking Results and Improvements

    Measuring Business Results

    Tracking key performance indicators (KPIs) helps you understand how your decisions are impacting your business. Here are some key areas to focus on:

    KPI Category Key Metrics Measurement Frequency
    Financial Revenue, Expenses, Net Income, Cash Flow Monthly
    Customer Retention Rate, Satisfaction Score, Lifetime Value Quarterly
    Operations Efficiency Ratios, Productivity Rates Weekly
    Marketing Customer Acquisition Cost, Conversion Rate Monthly

    To make your measurement process effective:

    • Set Clear Baselines: Start by documenting your current metrics before making any changes.
    • Leverage AI Tools: Tools like Salesforce Einstein (starting at $25/month) can automate data collection and provide real-time insights.
    • Monitor Customer Behavior: With nearly 90% of consumers beginning their shopping online, tracking digital interactions is crucial.

    For example, Fable & Mane adjusted their online presence by analyzing digital engagement and customer behavior during market shifts.

    Once you have a clear view of your metrics, focus on refining your strategies to meet your evolving goals.

    Adjusting Your Approach

    Data is only useful if it leads to action. Regularly reviewing your metrics allows you to refine your strategies based on what’s working. Companies using AI-driven KPIs are five times more likely to align their goals and incentives compared to those relying on traditional metrics.

    Focus on gathering actionable data that ties directly to your business goals, and stay ready to adjust as market conditions shift.

    If your metrics show areas of underperformance, don’t hesitate to pivot. Regular evaluations and adjustments are key to keeping your business on the right track for growth.

    Conclusion: Next Steps for Your Business

    Let’s take the strategies discussed earlier and put them into action to fuel business growth.

    Key Takeaways

    Making decisions based on data can increase profits by 8% and reduce costs by 10%. Here’s how you can tap into this potential:

    Focus Area Action Steps Impact
    Data Collection Use cloud tools and automate processes Cut down on manual tasks, gain real-time insights
    Analysis Tools Leverage AI-driven platforms Boost operational efficiency by 72%
    Team Development Invest in data literacy training Improve decision-making across teams
    Performance Tracking Regularly monitor KPIs and refine strategies Achieve 6% higher profits than competitors

    These steps pave the way to making smarter, data-backed decisions.

    Taking Action Today

    Start implementing these strategies now. For example, Corel Software saw a 106% revenue increase in 2024 by using data-driven campaigns.

    Here’s how to get started:

    • Define SMART Goals: Align your data collection efforts with clear, measurable business objectives.
    • Focus on Key Metrics: Identify the metrics that directly influence your revenue or cost savings.
    • Ensure Data Accuracy: Use proper data validation and cleansing processes to avoid errors.

    Even small changes can make a difference. Consider working with data analytics consultants or adopting cloud-based solutions to lower infrastructure costs. Businesses using these approaches are three times more likely to see major improvements in decision-making.

  • How to Collect More Google Reviews (Without Being Pushy)

    Ever wondered why some businesses have a steady stream of glowing Google reviews while yours only trickles in, even though you’re knocking it out of the park with great service? You’re not alone. For small and medium-sized business owners—whether you run a restaurant, a retail shop, or a local service—Google reviews can feel like elusive gold stars. They’re critical, though: reviews boost your credibility, help you rank higher in local searches, and sway new customers to choose you over the competition.

    The good news? You don’t have to plead, pay, or pester anyone to get more. With a few simple, respectful strategies, you can encourage happy customers to share their feedback—without being pushy. Let’s dive into five proven ways to collect more Google reviews, complete with real-world examples from businesses just like yours.


    1. Make It Easy for Customers to Leave Reviews

    Here’s the truth: if leaving a review feels like a chore, most customers won’t bother. The easier you make it, the more reviews you’ll get.

    • How to Do It: Share a direct link to your Google review page—shorten it with a QR code or a simple URL. Add a quick “how-to” on receipts, emails, or in-person chats.
    • Real-World Examples:
      • Restaurant: Picture a cozy Italian eatery. They print a QR code at the bottom of every receipt with a note: “Tell us about your meal!” One scan, and diners are on the review page—no hunting required.
      • Retail Outlet: A boutique clothing store slips a card into every shopping bag that says, “Loved your new outfit? Share your thoughts in 30 seconds!” with a short URL. Customers appreciate the simplicity.
    • Pro Tip: Track which methods—QR codes or email links—are bringing in the most reviews, so you can double down on what works.

    2. Ask at the Right Moment

    Timing is everything. Ask for a review when customers are smiling, not when they’re rushing out the door.

    • How to Do It: Strike while the iron’s hot—right after a compliment, a sale, or a great experience. Keep it casual with a line like, “We’d love to hear what you think!”
    • Real-World Examples:
      • Restaurant: A café owner chats with regulars as they pay: “So glad you enjoyed the latte—if you’ve got a sec, we’d love a quick review!” It feels natural, not forced.
      • Hair Salon: After a fresh cut, a stylist says, “Happy with the new look? It’d mean a lot if you shared it on Google.” The client’s still beaming in the mirror—perfect timing.
    • Bonus: With Miivo, you can see how review sentiment shifts over time. Its AI commentary might even spot those peak moments when customers are happiest, helping you refine your ask.

    3. Incentivize Without Begging

    You can’t pay for reviews (Google frowns on that), but you can nudge customers with subtle, policy-friendly incentives.

    • How to Do It: Try a “review and enter” contest—e.g., “Leave a review for a chance to win a $25 gift card!” (Open to all reviews, good or bad.) Or, thank reviewers after the fact with a small perk.
    • Real-World Examples:
      • Retail Outlet: A hardware store runs a monthly draw: “Review us this month for a shot at a free tool kit!” They announce winners on social media, keeping it fun and low-pressure.
      • Restaurant: A taco joint emails a “Thanks for reviewing!” 10% off coupon a week later. It’s a polite thank-you, not a bribe.
    • Heads-Up: Stick to Google’s guidelines—no quid pro quo. The goal is encouragement, not coercion.

    4. Leverage Your Online and Offline Presence

    You’re already connecting with customers—why not use those touchpoints to prompt reviews?

    • How to Do It: Add a review call-to-action (CTA) to your email signature, website footer, or social media bio. In-store, try a friendly sign with a QR code or URL.
    • Real-World Examples:
      • Restaurant: A diner sticks a “Enjoyed your meal? Scan here to let us know!” label on takeout bags. It’s eye-catching but not overbearing.
      • Pet Store: Their email receipts end with, “Your feedback helps us wag more tails—click here to review.” It’s on-brand and effortless.
    • Next Step: Curious which channel works best? Miivo can analyze how your ratings stack up against industry standards over time.

    5. Respond to Reviews (Yes, Even the Bad Ones)

    Here’s a secret: responding to reviews doesn’t just build trust—it encourages more people to leave them. Customers notice when you care.

    • How to Do It: Thank folks for positive feedback with a personal touch. For negative reviews, stay professional and offer a fix.
    • Real-World Examples:
      • Restaurant: A bistro replies to a 5-star review: “Thanks, Sarah—glad you loved the burger! Come back soon!” For a 3-star: “Sorry the wait was long, John—we’re adding staff. Hope to see you again!”
      • Auto Repair Shop: A mechanic responds to a 4-star: “Appreciate the feedback, Mike—working on speeding up oil changes!” It shows they’re listening.
    • Why It Works: Engagement signals your business is active. Plus, Miivo’s AI can spot trends in your reviews so you can keep improving.

    Wrap-Up: Start Small, Win Big

    Collecting more Google reviews doesn’t have to feel awkward or pushy. Make it easy with a QR code, ask at the perfect moment, offer subtle incentives, use your existing touchpoints, and respond to every review like it matters—because it does. Pick one tip to try today—maybe print that