Author: miivo

  • What Are the Best Fuelfinance Alternatives in 2026?

    What Are the Best Fuelfinance Alternatives in 2026?

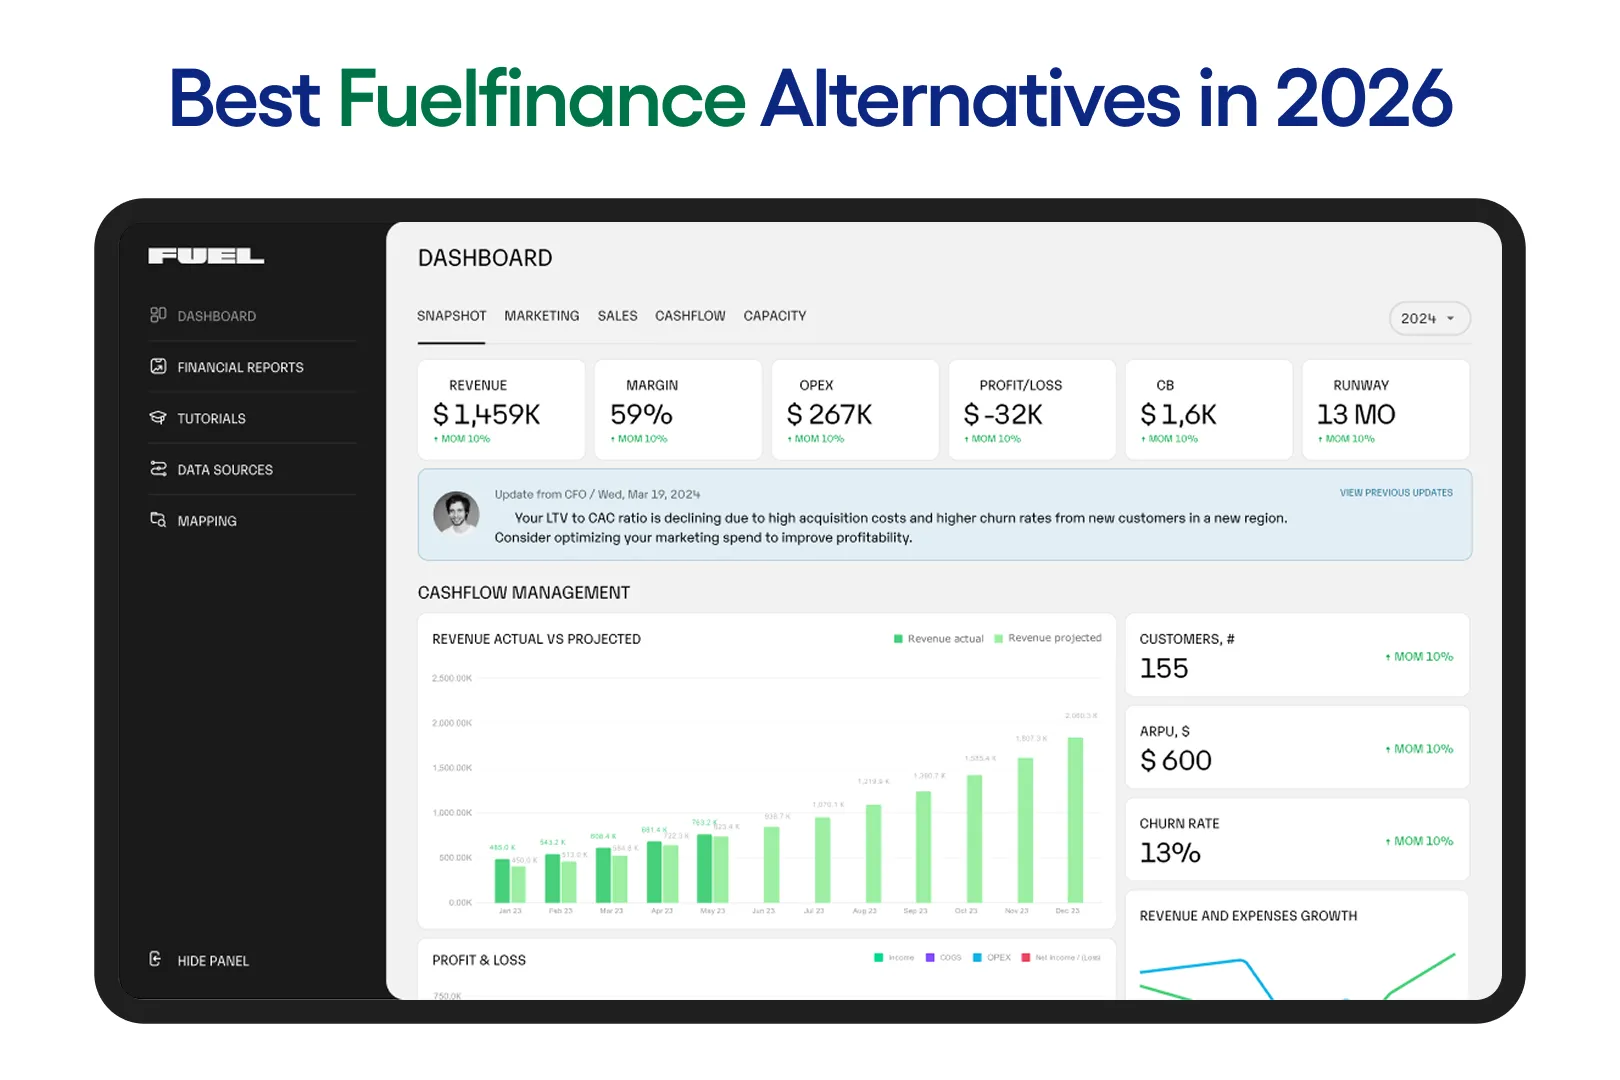
    Fuelfinance is a financial planning platform for startups and small businesses. It combines AI forecasting with a dedicated financial manager, which makes it useful for founders who need financial visibility without hiring a full-time CFO. That said, three clear reasons lead people to look elsewhere: the starting price of $1,199+ per month is a meaningful commitment for an early-stage business, the managed service model does not suit everyone who prefers self-serve financial planning and analytics (FP&A) software, and Fuelfinance is built specifically for digital businesses rather than physical ones.

    This page compares 7 Fuelfinance alternatives across those three reasons. These alternatives are for startups, agencies, and digital businesses looking for a different FP&A tool. One also caters to physical business owners like restaurants, salons, gyms, and retail shops, who need financial and operational data combined, which Fuelfinance is not built to deliver. Each alternative is reviewed on what it does, who it is best for, and what it does not do.

    For context: Fuelfinance is a cloud-based FP&A platform with AI forecasting, budget vs actual tracking, scenario planning, and a dedicated financial manager included in the subscription. Pricing is quote-based, but industry insights confirm it starts from $1,199 per month. It is built for startup founders and SMB owners without a finance background.

    Fuelfinance Alternatives, At A Glance

    Here is a quick summary before the full review of each alternative.

    ToolMain FocusHuman Team IncludedBest ForBiggest LimitationStarting Price
    MiivoPhysical business BIYes✅Physical businesses, Multi-location businessesNot an FP&A platformFrom $399/month
    Mosaic (now acquired by HiBob)AI FP&ANoSaaS and growth companies with finance teamEnterprise pricingCustom quote
    Pry (now Brex)Cash runway + FP&ANoPre-Series A startupsLimited depthFrom $12/user/month + add-on charges
    LiveFlowSpreadsheet syncNoFinance pros, accountantsSpreadsheet-dependentCustom quote, ranges from $200 – 1,500+/month
    Runway FinancialVisual cash modelingNoSeed-Series B startupsPricing opaquequote-based
    JiravMid-market FP&ANo$10M-$100M businessesComplex setupFrom $10,000/year
    FloatCash flow forecastingNoService businesses, agenciesCash focus onlyFrom $130/month

    Miivo: Business Intelligence Plus a Human Team, Built for Physical Businesses

    What Miivo Is

    Miivo is a business intelligence service with a dedicated human team for physical businesses. Like Fuelfinance, the BI tool combines software with a team that handles setup and interpretation. Unlike Fuelfinance, it connects operational data from the POS alongside financial data from accounting, which gives a physical business a complete daily view of what is actually happening across both sides of the operation.

    Best For

    Restaurant owners, salon groups, gym operators, and retail businesses who want financial and operational data combined automatically, with a human team handling setup and interpretation. No finance background required.

    What Miivo Does Well

    • Miivo joins financial data from accounting, POS data (covers, average spend, product performance), and customer review data into one automatic daily dashboard. 
    • AI Warning Signals flag when something changes before it shows up in your accounting software. 
    • Opportunity Cards surface specific actions with an estimated revenue impact. 
    • A dedicated human team handles all setup and maintenance. 
    • Live in 5 business days. 
    • Pricing is published and fixed.

    What Miivo Does Not Do

    Miivo is not an FP&A platform. It does not do scenario planning, forecasting, or startup runway modeling in the Fuelfinance sense. It is not ideal for SaaS companies, agencies, or digital businesses but is suitable if the business has a physical location.

    Pricing: Free Ready To Use with no credit card requirement, Built For You at $399/month. Managed Services at $1,299/month. Setup included.

    What Makes Miivo Stand Out?

    Every alternative on this list except Miivo is built mainly for digital businesses. If you run a restaurant, salon, gym, or retail shop, the tools below will not connect to your POS, will not show you covers or average spend, and will not tell you why a Tuesday in March performed differently from the one before it. Fuelfinance has the same limitation. The alternative built for physical businesses is Miivo.  

    See how Miivo works for physical businesses

    Mosaic: AI-Powered FP&A for SaaS and Growth-Stage Businesses

    What Mosaic Is

    Mosaic is an AI-powered FP&A platform built for SaaS and growth-stage businesses, now acquired by HiBob. It connects with accounting software (QuickBooks, NetSuite), CRM platforms (Salesforce, HubSpot), HRIS tools, and billing systems to build a unified financial model. The platform surfaces SaaS-specific metrics, like ARR (Annual Recurring Revenue), churn, CAC (Customer Acquisition Cost), and LTV (Customer Lifetime Value), automatically, without requiring manual data entry from your finance team.

    Best For

    SaaS companies and growth-stage startups with a finance team or CFO who want automated financial modeling and AI-powered anomaly detection. Works best for businesses in the $5M to $50M ARR range that have outgrown spreadsheets but do not yet need enterprise software.

    What Mosaic Does Well

    • Handles SaaS-specific financial metrics better than most FP&A tools. 
    • AI-powered insights and anomaly detection flag changes in real time. 
    • Headcount planning is built in, which matters for teams managing hiring against a financial model. 
    • The interface is modern and well-reviewed by finance leaders at growth-stage companies.

    What Mosaic Does Not Do

    Mosaic does not include a dedicated human financial manager. It is fully self-serve, which means that the finance team builds and maintains its own models. It is not built for physical businesses. Pricing sits in the enterprise range, which makes it a difficult fit for early-stage startups watching costs closely.

    Pricing: Custom pricing, not published. Typically $1,000 to $3,000+ per month for growth-stage companies. Demo required.

    Is Mosaic Worth It for an Early-Stage Startup?

    Not usually, as Mosaic is priced and designed for companies with a finance team already in place. If you are pre-Series A without a dedicated CFO or financial analyst, you need more practical starting points.

    Pry (Now Brex): Cash Runway and FP&A for Early-Stage Startups

    What Pry Is

    Pry is a financial planning platform for early-stage startups, now part of Brex. It covers budget vs actual tracking, cash runway, hiring plan modeling, and scenario planning. The platform integrates with QuickBooks, Xero, Gusto, and Brex spend management. The tool is designed for founders who need financial visibility without a dedicated finance person.

    Best For

    Pre-revenue to Series A startups and early-stage founders who need to track cash runway, manage headcount forecasting, and run basic scenario planning. Works well as a first step beyond spreadsheets for teams without a full-time finance hire.

    What Pry Does Well

    • Budget vs actual tracking updates automatically with bank sync. 
    • Cash runway projections are visual and easy to read. 
    • The hiring plan tracks headcount and fully loaded employee costs, which is useful when modeling the impact of new hires on runway. 
    • Scenario planning is accessible. 
    • Pricing is significantly lower than Fuelfinance.

    What Pry Does Not Do

    Pry does not include a dedicated human financial manager. it is self-serve. The depth of financial modeling is lighter than Fuelfinance or Mosaic, which makes it better suited to simpler business models. Physical business data (POS, bookings, operational metrics) is not supported.

    Pricing: Free plan available as Essesntials. Paid Premium plan starts from $12/user/month, while Enterprise plan is custom.

    Pry vs Fuelfinance: What Changes?

    The main trade-off is human support vs cost. Fuelfinance includes a dedicated financial manager, Pry does not. If the fractional CFO model is what you need, Pry will not replace it. If you want a self-serve tool at a lower price point, Pry covers the core FP&A functions for early-stage businesses.

    LiveFlow: FP&A That Stays Inside Google Sheets and Excel

    What LiveFlow Is

    LiveFlow is a Google Sheets and Excel-based FP&A tool that automatically syncs accounting data from QuickBooks, Xero, and NetSuite into existing spreadsheet models. It removes the manual copy-paste step between accounting software and your financial models, which keeps spreadsheets live without rebuilding them.

    Best For

    Finance professionals and accountants who work mostly in Google Sheets or Excel and want to keep that workflow while automating data sync from accounting software. Also works well for agencies and advisory firms that manage multiple clients from a single spreadsheet setup.

    What LiveFlow Does Well

    • LiveFlow stays inside Google Sheets and Excel. 
    • There is no new interface to learn. 
    • Automatic data sync removes the manual update cycle from financial reporting. 
    • Multi-client management makes it practical for accounting firms and agencies that run consolidated reporting across several entities. 

    What LiveFlow Does Not Do

    LiveFlow requires comfort with spreadsheets. It is not a dashboard-first product and does not suit users who want a purpose-built FP&A interface. There is no dedicated human financial manager too. Physical business data is not supported.

    Pricing: Custom pricing, after booking demo. According to industry data pricing typically starts from $200 to $1,500+ per month for enterprise level.

    Who Should Not Use LiveFlow?

    Anyone who wants to move away from spreadsheets entirely. LiveFlow is a tool that helps with the spreadsheet workflow; it does not replace it. If the reason you are looking for a Fuelfinance alternative is that your current process is too spreadsheet-heavy, LiveFlow will not solve that.

    Runway Financial: Visual Cash Flow Modeling for Startup Founders

    What Runway Financial Is

    Runway Financial is a financial planning and scenario modeling platform with a strong visual interface. It connects with QuickBooks, Stripe, Gusto, and other common startup tools to build a financial model that displays as a timeline instead of a spreadsheet. The platform focuses on cash flow modeling, hiring plans, and scenario planning for growth-stage businesses.

    Best For

    Seed to Series B startups and growth companies that want visual cash flow modeling and scenario planning with a modern interface. Suitable for founders who prefer to see their financial model as a timeline and want AI-powered insights built into that view.

    What Runway Financial Does Well

    • The visual interface makes complex financial models accessible to founders without a finance background. 
    • Scenario planning updates in real time across dashboards. 
    • Integrations with common startup tools (Stripe, Gusto, QuickBooks) work well for digital businesses with a standard stack. 
    • AI-powered insights surface anomalies automatically.

    What Runway Financial Does Not Do

    Runway Financial does not include a dedicated human financial manager and is self-serve. Depth of financial modeling is less than enterprise-grade FP&A tools. Pricing is not published, which makes it harder to evaluate without going through a demo.

    Pricing: Custom. Demo required. Estimated mid-hundreds per month for startups.

    Is Runway Financial the Right Fit for Your Stage and Budget?

    Runway Financial works well when your main job is modeling growth for investors. It does not fit as smoothly when you run a local business that needs daily operational insights instead of funding scenarios.

    Jirav: FP&A for Mid-Market and Professional Services Businesses

    What Jirav Is

    Jirav is an FP&A platform for mid-market and professional services companies. The finance tool combines financial and operational data, supports headcount planning, multi-entity consolidation, and board reporting. The platform integrates with NetSuite, QuickBooks, Salesforce, and other platforms used by businesses in the $10M to $100M revenue range.

    Best For

    Professional services firms, agencies, and mid-market companies that need multi-entity financial consolidation and operational data combined with financial planning. Works best for businesses that have outgrown early-stage tools and need board-ready reporting across multiple departments or legal entities.

    What Jirav Does Well

    • Multi-entity consolidation is Jirav’s biggest selling point for businesses with complex legal structures or multiple departments. 
    • Operational and financial data are modeled together. 
    • Headcount planning is built in and detailed. 
    • Board-ready reporting templates reduce the time spent formatting financial presentations.

    What Jirav Does Not Do

    Jirav is more complex and more expensive than early-stage tools. It typically requires onboarding support to set up correctly. There is no dedicated ongoing human financial manager. Physical business operational data is not natively supported.

    Pricing: Custom. Not published. Typically starts from $10,000+ annually.

    What’s Different Between Jirav and Fuelfinance?

    Fuelfinance is designed for founders without a finance background who need their first layer of financial visibility. Jirav is designed for businesses that already have a finance function and need to manage more complex reporting. The two tools serve different stages of the same growth path.

    Float: Cash Flow Forecasting, and Nothing Else

    What Float Is

    Float is a cash flow forecasting tool that connects directly with QuickBooks, Xero, and FreeAgent to build an automated cash flow forecast. Its single focus is showing how much cash the business will have and when. The tool does not attempt to be a full FP&A platform.

    Best For

    Service businesses, agencies, and small businesses that need to forecast their cash position week by week, manage client payment timing, and avoid cash flow surprises. Works well as a focused add-on alongside an accounting tool for businesses that do not need scenario planning or headcount modeling.

    What Float Does Well

    • Float builds an automatic cash flow forecast directly from accounting data. 
    • Scenario modeling for cash is practical: it shows what happens if a client pays late, if a large invoice lands early, or if a recurring cost increases. 
    • The interface is visual and easy to read. 
    • Pricing is affordable compared to full FP&A platforms.

    What Float Does Not Do

    Float is a cash flow forecasting tool only, it does not do P&L planning, headcount modeling, or scenario planning beyond cash. There is no human advisor included. Physical business operational data is not supported.

    Pricing: Pricing available in GBP, USD, AUD, and EUR. Starter Essentials plan costs $130/month. Growth plan costs $265/month, while Scale plan starts from $389/month. Annual discounts available.

    Is Float the Right Cash Flow Tool for Your Business?

    Float earns its place on this list for one specific situation: a service business or agency that invoices on net terms, manages irregular payment timing, and needs to know every day whether cash is going to be tight in the next few weeks. For that job, it is fast to set up, affordable, and genuinely useful. The moment the need expands to P&L planning, headcount modeling, or investor reporting, Float stops being enough. It is not a weakness of the tool, it is the product’s design.

    Which Fuelfinance Alternative Is Right for Your Situation?

    The following common situations clearly point to the need for specific tools.

    1. You are an early-stage startup founder who needs to track runway and plan headcount without hiring a finance person: Pry is the most accessible starting point, as it is affordable, integrates with QuickBooks and Xero, and covers the basics: budget vs actual, cash runway, and hiring plan modeling.
    2. You run a SaaS business with a finance team and need AI-powered financial modeling: Mosaic is the strongest option because it is built specifically for SaaS metrics and growth-stage financial planning, with good integrations across CRM, HRIS, and billing platforms.
    3. You work in Google Sheets or Excel and want to stop updating your models manually: LiveFlow is built for exactly this to keep your existing spreadsheet workflow while automating the data sync from accounting software. It removes the manual step without changing how you work.
    4. You need focused cash flow forecasting and not a full FP&A platform: Float is the most specialized option for this. It is simple, affordable, and does one thing well: showing how much cash the business will have and when.
    5. You run a physical business, such as a restaurant, salon, gym, or retail shop, and need financial and operational data combined automatically: Miivo is the only option on this list built for physical businesses. The Fuelfinance alternative connects POS data alongside financial data and includes a dedicated human team, without you requiring a finance background or technical setup.

    Running a Physical Business and Looking for a Fuelfinance Alternative?

    Book a 15-minute call and Miivo will connect to your data and show you what your financial and operational picture looks like inside the platform.

    [Book a 15-minute call]

    *No credit card. No commitment. See your data first.
  • What Are the Best Nume.ai Alternatives in 2026?

    What Are the Best Nume.ai Alternatives in 2026?

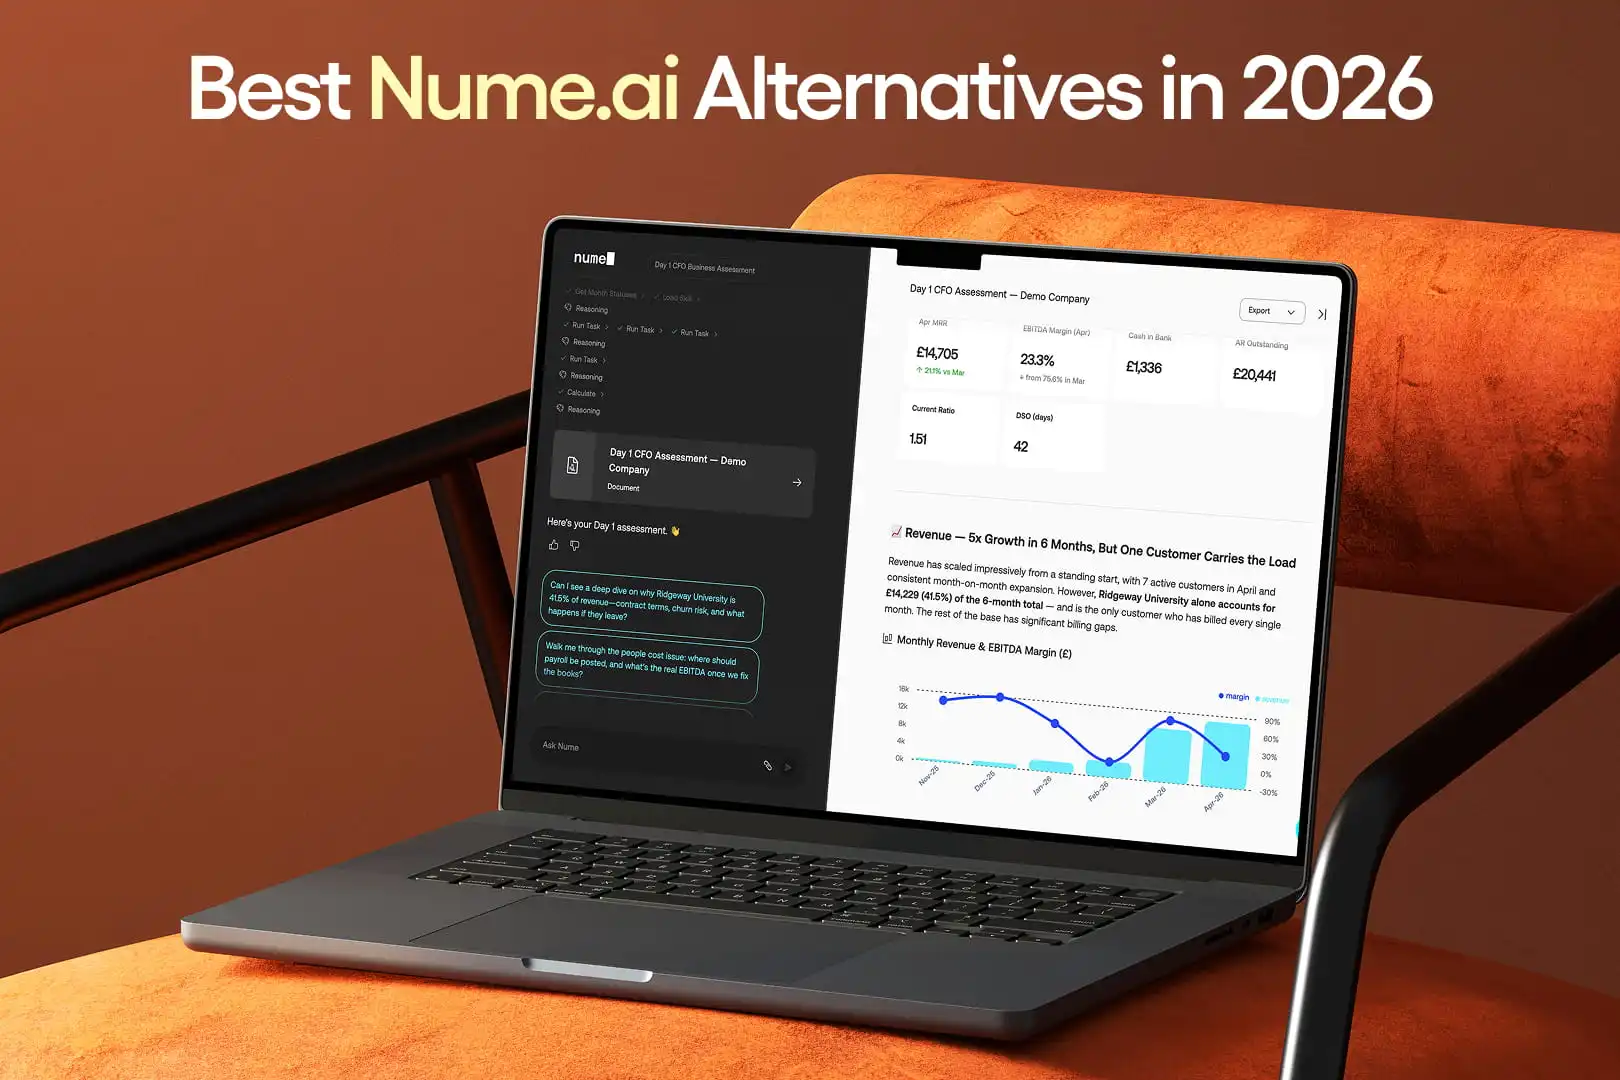
    Nume.ai is an AI-powered CFO platform for startup founders and SMEs. The financial system connects to QuickBooks, Xero, and bank accounts to provide real-time financial monitoring, instant reports, cash flow alerts, and board report generation, all powered by AI. At $100 per month for the Pro plan, it is significantly more affordable than comparable tools. The main reasons people look for an alternative is because they want a human expert besides the AI, need more FP&A depth, need bookkeeping included, or run a physical business that Nume.ai is not the right fit for.

    This article compares 7 best alternatives to Nume.ai in 2026. Miivo is reviewed first for physical business owners who need financial and operational data combined, something no other alternative here provides. The other six cover different needs for digital businesses and startups: Fuelfinance if you want a human financial manager included, Mosaic for deeper SaaS FP&A, Pry for an affordable early-stage option, LiveFlow if you prefer staying in spreadsheets, Float for cash flow specifically, and Jirav for mid-market complexity.

    This comparison focuses on small businesses and startups. Enterprise FP&A tools like Anaplan, Workday Adaptive, or Planful are acknowledged but not reviewed in depth because they require dedicated finance teams and hefty budgets.

    Comparison of The Best Nume.ai Alternatives in 2026

    Here is a quick summary before the full review of each.

    ToolMain FocusHuman Team IncludedBest Forvs Nume.aiStarting Price
    MiivoPhysical business BIYes (full team)Small physical businessesDifferent audience, has human teamFree,Starts from $399/month
    FuelfinanceFP&A + human managerYes (financial manager)Startups/agencies wanting human supportMore expensive, adds human managerCustom, Starts from $1,199/month
    Mosaic (acquired by HiBob)SaaS FP&ANoSaaS with finance teamMore FP&A depth, more expensiveCustom
    Pry (Brex)Cash runway + FP&ANoPre-Series A startupsCheaper, less depthFree, Starts from $12/user/month
    LiveFlowSpreadsheet syncNoAccountants, finance prosSpreadsheet-focused, no monitoringCustom quote, Starts from $200/month
    FloatCash flow forecastingNoService businesses, agenciesCash focus only, simplerFrom $130/month
    JiravMid-market FP&ANo$10M to $100M businessesMore complex, multi-entityCustom, From $10,000/year

    These tools cover the full spectrum of AI-powered financial management for startups and growing businesses. Each solves a different version of the same problem, which is to get accurate, actionable financial insight without a full-time finance team.

    Miivo: Business Intelligence Plus a Human Team, Built for Physical Businesses

    What Miivo Is

    Miivo is a business intelligence service with a dedicated human team for physical businesses. The BI platform uses AI to give small business owners financial visibility automatically, just like Nume.ai. Additionally, the tool connects operational data from the POS alongside financial data from accounting, and includes a dedicated human team that handles setup and interpretation from day one.

    Best For

    Restaurant owners, salon groups, gym operators, and retail businesses who want financial and operational data combined automatically, with a human team handling setup and interpretation.

    What Miivo Does Well

    • Miivo joins financial data from accounting, POS data (covers, average spend, product performance), and customer review data into one automatic daily dashboard. 
    • AI Warning Signals flag problems before they compound. 
    • Opportunity Cards surface specific actions you can take to improve margins. 
    • The dedicated human team handles all setup and interpretation, and the service goes live in 5 business days. 
    • Pricing is transparent with no hidden fees.

    What Miivo Does Not Do

    • Not an AI CFO platform for startups. 
    • Does not generate board reports, do scenario planning, or provide startup runway modeling. 
    • Not ideal for SaaS companies or digital businesses. It is best suited if the business has a physical location.

    Pricing

    Ready To Use: Free, no credit card required.

    Built For You: $399 per month. 

    Managed Services: at $1,299 per month. Setup included.

    See how Miivo works for physical businesses

    Fuelfinance: The Most Similar to Nume.ai, With a Human Financial Manager Added

    What Fuelfinance Is

    Fuelfinance is an FP&A platform for startups and agencies that combines AI forecasting, budget vs actual tracking, and scenario planning with a dedicated human financial manager included in the subscription. The finance tool is the closest alternative to Nume.ai in terms of audience, with the key difference being the addition of a human expert who understands your business and acts alongside the AI.

    Best For

    Startup founders and SMB owners who want both the AI financial software and a dedicated human financial manager. If the absence of human support is the main reason you are looking away from Nume.ai, Fuelfinance is the most direct replacement.

    What Fuelfinance Does Well

    • Combines AI forecasting, budget vs actual reporting, scenario planning, and anomaly detection with a dedicated financial manager who acts as a fractional CFO. 
    • The human-plus-AI combination is the biggest advantage over Nume.ai. 
    • Has an established track record, a broader user review history, and 350+ integrations across accounting, CRM, and data tools.

    What Fuelfinance Does Not Do

    • Fuelfinance is significantly more expensive than Nume.ai, starting at $1,199 per month compared to $100. 
    • Not built for physical businesses. 
    • There is no POS or operational data integration. 
    • The premium price reflects the human manager inclusion, so self-serve-only users who do not need that layer may not find the cost justified.

    Pricing 

    Pricing starts from $1,199 per month for 1st tier, $2,399 per month for the 2nd tier and higher tier plans are custom-quoted for established businesses. Fuelfinance does not offer a free trial.

    Mosaic: AI-Powered FP&A for SaaS and Growth-Stage Businesses

    What Mosaic Is

    Mosaic is an AI-powered FP&A platform built for SaaS companies and growth-stage businesses, now acquired by HiBob. The finance software connects with accounting systems like QuickBooks and NetSuite, CRM tools such as Salesforce and HubSpot, and billing platforms to build a unified financial model across the organization.

    Best For

    SaaS companies and growth-stage startups that have a finance team or CFO on board and need deeper financial modeling than Nume.ai’s monitoring and alert-focused approach.

    What Mosaic Does Well

    • Tracks SaaS-specific metrics, such as ARR, churn, CAC, and LTV, with precision. 
    • Includes AI-powered insights, anomaly detection, and headcount planning. 
    • The interface is clean and modern.
    • FP&A depth goes well beyond what Nume.ai offers for companies that have the internal capability to configure and maintain financial models.

    What Mosaic Does Not Do

    • Does not include a dedicated human financial manager. 
    • More expensive than Nume.ai and is best suited to companies with someone technical enough to build and maintain the models. 
    • Physical business data is not supported. 
    • Founders at the earliest stages, without a finance team, will likely find the complexity unnecessary.

    Pricing

    Custom pricing, typically $1,000 to $3,000+ per month. A demo is required before access.

    Pry (Brex): Cash Runway and FP&A for Early-Stage Startups

    What Pry Is

    Pry (now Brex) is a financial planning platform for early-stage startups that covers budget vs actual tracking, cash runway visualization, and hiring plan management. The financial software was acquired by Brex and positions itself as an accessible first step beyond spreadsheets for early-stage founders.

    Best For

    Pre-revenue to Series A founders who need to track runway, manage headcount forecasting, and run basic scenario planning on a tight budget. Pry is the most accessible starting point for founders who find Nume.ai either too expensive or more feature-rich than their current stage requires.

    What Pry Does Well

    • Offers a free plan. 
    • Syncs automatically with bank accounts for budget vs actual reporting, visualizes cash runway clearly.
    • Includes a hiring plan that tracks headcount and fully loaded employee costs. 
    • For simple business models at the earliest stage, it covers the core bases without a significant monthly commitment.

    What Pry Does Not Do

    • Does not include a dedicated human advisor. 
    • Feature depth is lighter than Nume.ai or Fuelfinance, and it works best for straightforward business models rather than complex financial structures. 
    • Physical business data is not supported.
    • Does not offer the proactive financial monitoring or board report generation that Nume.ai provides.

    Pricing

    Essentials: $0 per user per month. 

    Premium: $12 per user per month.

    Enterprise: Custom pricing.

    LiveFlow: FP&A That Lives Inside Google Sheets and Excel

    What LiveFlow Is

    LiveFlow is a tool that automatically syncs accounting data from QuickBooks, Xero, or NetSuite directly into existing Google Sheets and Excel models. The FP&A software removes the need to manually export data, while keeping finance professionals inside the spreadsheet environment they already use.

    Best For

    Finance professionals and accountants who want to keep working inside spreadsheets while automating the data pull from their accounting system. LiveFlow also supports multi-client management, which makes it practical for accounting firms managing multiple entities.

    What LiveFlow Does Well

    • Stays inside Google Sheets and Excel, so there is no new interface to learn. 
    • Data sync runs automatically, which completely removes the manual export-and-paste process that consumes time in most spreadsheet-based workflows. 
    • Affordable relative to most FP&A platforms
    • Handles multi-client setups cleanly.

    What LiveFlow Does Not Do

    • Requires comfort with spreadsheets. 
    • Not a monitoring or alert platform in the way Nume.ai is. 
    • No proactive signals, no AI Q&A, and no board report generation. 
    • If the reason you are looking away from Nume.ai is that you want more automation, LiveFlow moves in the opposite direction.
    • Physical business data is not supported.

    Pricing

    Custom pricing, typically ranges from $50-200+ per month to $1,500+ per month and even higher for multi-entity and enterprise-level businesses. Demo is required.

    Float: Cash Flow Forecasting Only

    What Float Is

    Float is a cash flow forecasting tool that connects directly with QuickBooks, Xero, and FreeAgent to build automated cash flow forecasts. The simple tool has a single, clearly defined focus and does not attempt to expand beyond it.

    Best For

    Service businesses and agencies that need to forecast their cash position week by week and avoid cash flow surprises. Float suits founders or finance managers who want a simple, visual tool for cash management instead of a full AI financial monitoring platform.

    What Float Does Well

    • Builds an automatic cash flow forecast from accounting data without complex setup. 
    • Scenario modeling allows users to test the impact of different decisions on cash position. 
    • The interface is visual and easy to read, and it is one of the more affordable dedicated tools on this list.

    What Float Does Not Do

    • Covers cash flow forecasting only, it is not a full AI CFO platform. 
    • There is no broader financial monitoring, no board report generation, no AI Q&A, and no anomaly detection across other financial metrics. 
    • No dedicated human advisor, and physical business data is not supported.

    Pricing

    Essentials: $130 per month. 

    Growth: $265 per month.

    Scale: Starts from $389 per month. 

    20% discount on annual billing. Pricing available in GBP, USD, AUD, and EUR. 14-day free trial.

    Jirav: Best Mid-Market FP&A Platform

    What Jirav Is

    Jirav is an FP&A platform built for mid-market and professional services companies. The finance tool combines financial and operational data across multiple entities or departments and is designed for organizations with more complexity than a typical early-stage startup carries.

    Best For

    Professional services firms and mid-market companies with revenue between $10 million and $100 million that need consolidated financial planning across multiple entities, departments, or business units. Jirav suits organizations that have grown past the capabilities of simpler tools and need multi-entity consolidation and effective headcount planning.

    What Jirav Does Well

    • Handles multi-entity consolidation with precision.
    • Combines operational and financial data into a unified view. 
    • Headcount planning and board-ready reporting are strong.
    • FP&A depth significantly exceeds what Nume.ai offers for companies operating at that level of complexity.

    What Jirav Does Not Do

    • More complex and more expensive than Nume.ai. 
    • Requires onboarding support to configure properly. 
    • There is no dedicated ongoing human advisor included in the subscription. 
    • Physical business data is not natively supported.
    • Pricing and complexity make it unsuitable for early-stage startups.

    Pricing 

    Custom pricing, not published. Mid-market range, typically $10,000+ annually.

    Which Nume.ai Alternative Is Right for Your Situation?

    Different situations call for different tools. Following are the most common reasons someone looks for a Nume.ai alternative, and the tool that fits each one.

    1. You run a physical business (restaurant, salon, gym, or retail) and need financial and operational data combined, not just financial monitoring: Miivo is the most suitable Nume.ai alternative, as it connects POS data alongside financial data and includes a dedicated human team that handles setup and interpretation. None of the other alternatives on this list connect to a POS system or serve physical business owners.
    2. You want an AI financial tool with a human expert you can actually speak to: Fuelfinance is the closest competitor, it combines AI forecasting with a dedicated human financial manager included in the subscription. It is more expensive than Nume.ai, but the human element is the key difference and the main reason to choose it over a pure AI alternative.
    3. You are an early-stage startup founder on a tight budget: Pry is the most accessible starting point. The tool has a free plan, covers budget vs actual tracking, cash runway, and hiring plan management without the monthly commitment that Fuelfinance or Mosaic requires.
    4. You want to keep working in Google Sheets or Excel with automated data sync: LiveFlow automates the data pull from QuickBooks or Xero into your existing spreadsheet models. The software does not force a new interface, and it keeps your workflow exactly where it already lives.
    5. You primarily need to forecast and manage cash flow: Float is the simplest, most focused option for managing cash flow only. It performs this one thing well, it is visual, it is affordable, and it does not require you to learn or configure a broader FP&A platform to get value from it.

    Running a Physical Business and Looking for a Nume.ai Alternative?

    Book a 15-minute call and we will connect to your data and show you what your financial and operational picture looks like inside Miivo.

    [Book a 15-minute call]

    *No credit card. No commitment. See your data first.
  • How Do You Track Budget vs Actual Performance in Your Business?

    How Do You Track Budget vs Actual Performance in Your Business?

    Most businesses set a budget at the start of the year, but very few actually use it. By the end of January it is sitting untouched while decisions are made based on the bank balance and a rough sense of how things are going. A budget only becomes useful when you compare it to what actually happened. That comparison, done regularly, turns a budget from a planning document into a tool that tells you when something needs to change.

    What Is Budget vs Actual Analysis and Why Does It Matter?

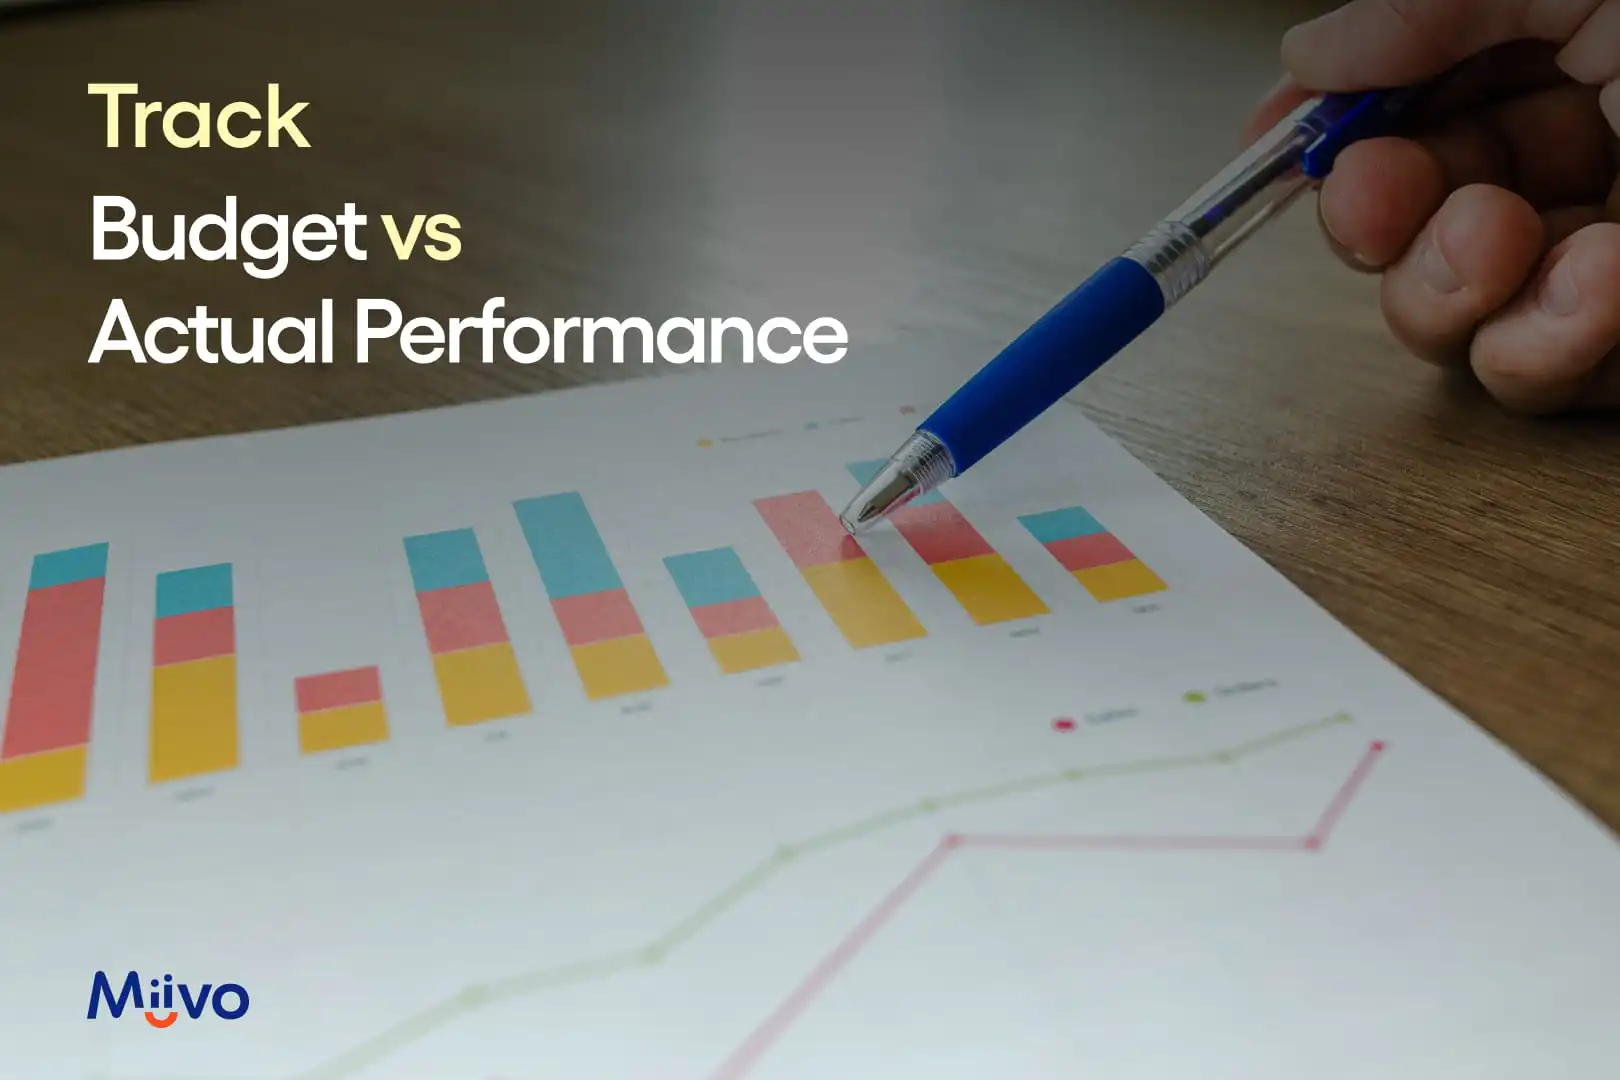
    Budget vs actual analysis is the practice of comparing what you planned to happen financially with what actually happened, then examining the variance to understand what is going on and what to do about it. A budget without this comparison is just a guess made at the start of the year. A budget with regular comparison becomes a measurement system that tells you when costs are drifting, when revenue is underperforming, and when you need to act before a problem grows. According to Rae & Associates, the days of setting a budget in January and checking it in December are over. In 2026, costs are shifting, markets are changing, and cash flow is tightening. It is time to actually turn financials into a decision-making tool.

    What Should a Small Business Include in a Budget vs Actual Comparison?

    A budget vs actual comparison covers more than just revenue and expenses. For a physical business, it has two layers.

    Financial budget vs actual

    Track revenue against target, cost of goods sold as a percentage of revenue, gross margin, operating expenses by category, and net profit. These figures come from the profit and loss statement in your accounting software. One important note: your budget categories must match your accounting categories exactly. If they do not align, the comparison will not produce meaningful results.

    Operational budget vs actual (for physical businesses)

    For a restaurant, operational budget vs actual comparison includes covers served against a target, table turnover rate, average spend per cover, and food cost percentage against a planned figure. For a salon, it includes appointment fill rate, rebooking rate, and revenue per treatment hour. For a gym, it includes class fill rate and membership retention against plan. These operational numbers explain why the financial numbers look the way they do.

    Covering budget vs actual for physical businesses and stopping at the P&L only gives half the picture. A restaurant can hit its revenue target while running unsustainable food cost and labor variances underneath it. Without operational data alongside financial data, the variance report cannot tell you why the numbers moved.

    How Do You Calculate and Interpret a Budget Variance?

    The calculation is straightforward. Variance equals actual minus budget; a positive number means actual was higher than budget. Whether that result is favorable depends on whether the line is revenue or cost.

    Line ItemBudgetActualVarianceLabel
    Revenue$80,000$74,000-$6,000Unfavourable; revenue came in below plan
    Food cost$22,000$19,500-$2,500Favourable; cost was lower than planned
    Labor$18,000$21,000+$3,000Unfavourable; labor ran over plan

    A positive variance is not always good news, and a negative one is not always bad. Investigate both, as a revenue variance below budget needs a reason, so does one that is significantly above it. As CFO Share notes, “The value is not in printing the report. It is in interpreting it.”

    How Often Should a Small Business Review Budget vs Actual?

    Financial budget vs actual should be reviewed monthly, once accounts are reconciled for the previous month. This is the minimum cadence to catch a drifting cost or a revenue gap while there is still time to act. For a physical business, operational metrics need an even shorter review loop. A restaurant owner who checks covers against target only at month-end is finding out too late to change anything. A weekly operational review, at minimum, and a daily view of covers and revenue against the week’s target is the standard for any business where daily performance varies significantly. Some businesses also use a rolling forecast besides the static budget to adjust expectations mid-period when conditions shift materially.

    What Are the Most Common Budget vs Actual Tracking Mistakes Small Businesses Make?

    Most small businesses make the same few mistakes when tracking variances.

    • Setting the budget and never looking at it again: A budget reviewed once a year is not a management tool, it is a document. Monthly comparison is the minimum for it to have any practical value.
    • Only tracking revenue and ignoring cost variances: An unfavorable cost variance can offset a favorable revenue one completely. Tracking only the top line gives half the picture.
    • Treating every variance the same: A small variance that is growing month over month is more dangerous than a large one-off variance. Direction and trend matter as much as the absolute number.
    • Not acting after finding a variance: The value is not in the report; it is in what the report prompts. A variance without a follow-up question and a corrective action is just wasted analysis.

    How Do Physical Businesses Track Budget vs Actual Across Financial and Operational Data?

    The challenge for a small physical business is that financial budget vs actual comes from the accounting software, and operational budget vs actual comes from the POS, the bookings system, and the review platforms. Pulling both together manually every week is time-consuming enough that most owners give up and go back to checking the bank balance. Miivo’s AI Business Dashboard connects the financial data from accounting and the operational data from the POS automatically, flagging when either is moving outside its planned range without the owner having to pull the numbers themselves.

    Which KPIs Should a Small Business Track Against Its Budget?

    A small business’s KPIs to track against its budget include budget variance, net profit margin, operating cash flow, and customer acquisition cost. A small business must carefully cover the KPIs that matter most for its type and prioritize them in its review process. 

    What is the difference between budget vs actual and a forecast?

    A budget is set once, typically at the start of a financial year, and reflects your original plan. A forecast is updated regularly to reflect current expectations based on actual results to date. Budget vs actual compares performance against the original plan. A rolling forecast adjusts the target as conditions change.

    What Does a Business Dashboard Show for Budget vs Actual Tracking?

    The most practical way to review budget vs actual regularly is in a dashboard that updates automatically. A business dashboard brings data from all the sources, including accounting, POS, and CRM, and compares them to track preset budget vs actual results.

    Can a small business track budget vs actual without an accountant?

    Yes, the core calculation, actual minus budget, requires only that your accounting categories match your budget categories. The more common barrier is consistency. Most small business owners start the process and stop when it becomes manual and time-consuming.

    How do operational metrics connect to financial variances?

    Operational metrics explain the cause behind financial variances. A food cost percentage running above budget is a financial variance. The reason may be a supplier price increase, a portion control issue, or waste. None of those causes appear in the P&L, they appear in operational data.

    What is the minimum setup needed to start budget vs actual tracking?

    The minimum setup needed to start budget vs actual tracking includes a written budget broken down by month and by category, accounting records kept in categories that match the budget, and a scheduled monthly review. Start with financial figures. Add operational metrics once the financial comparison is running consistently.

    Frequently Asks Questions

    Which KPIs should a small business track against its budget?

    A small business’s KPIs to track against its budget include budget variance, net profit margin, operating cash flow, and customer acquisition cost. A small business should prioritize the KPIs that matter most for its type in its review process.

    What is the difference between budget vs actual and a forecast?

    A budget is set once, typically at the start of a financial year, and reflects your original plan. A forecast is updated regularly to reflect current expectations based on actual results to date. Budget vs actual compares performance against the original plan. A rolling forecast adjusts the target as conditions change.

    Can a small business track budget vs actual without an accountant?

    Yes, the core calculation, actual minus budget, requires only that your accounting categories match your budget categories. The more common barrier is consistency. Most small business owners start the process and stop when it becomes manual and time-consuming.

    How do operational metrics connect to financial variances?

    Operational metrics explain the cause behind financial variances. A food cost percentage running above budget is a financial variance. The reason may be a supplier price increase, a portion control issue, or waste. None of those causes appear in the P&L, they appear in operational data.

    What is the minimum setup needed to start budget vs actual tracking?

    The minimum setup needed to start budget vs actual tracking includes a written budget broken down by month and by category, accounting records kept in categories that match the budget, and a scheduled monthly review. Start with financial figures, then add operational metrics once the financial comparison is running consistently.

  • What Is the Difference Between FP&A Software and Business Intelligence?

    What Is the Difference Between FP&A Software and Business Intelligence?

    If you search for a comparison of FP&A software and business intelligence, most results are written by companies that sell FP&A tools. Their answer to the question ‘which one do you need?’ will always be FP&A, because that is what they are selling. This page is written from the other side. If you are a small business owner trying to understand whether you need FP&A, BI, or something else entirely, here is an honest breakdown.

    This page explains what FP&A software actually does, what business intelligence actually does, where they overlap, and, most importantly, which one fits your business based on your size, your team, and what problem you are actually trying to solve. If you run a small physical business and have landed here after being confused by a software pitch, you will likely find your answer in the decision framework at the end.

    What Is FP&A Software and Who Is It Built For?

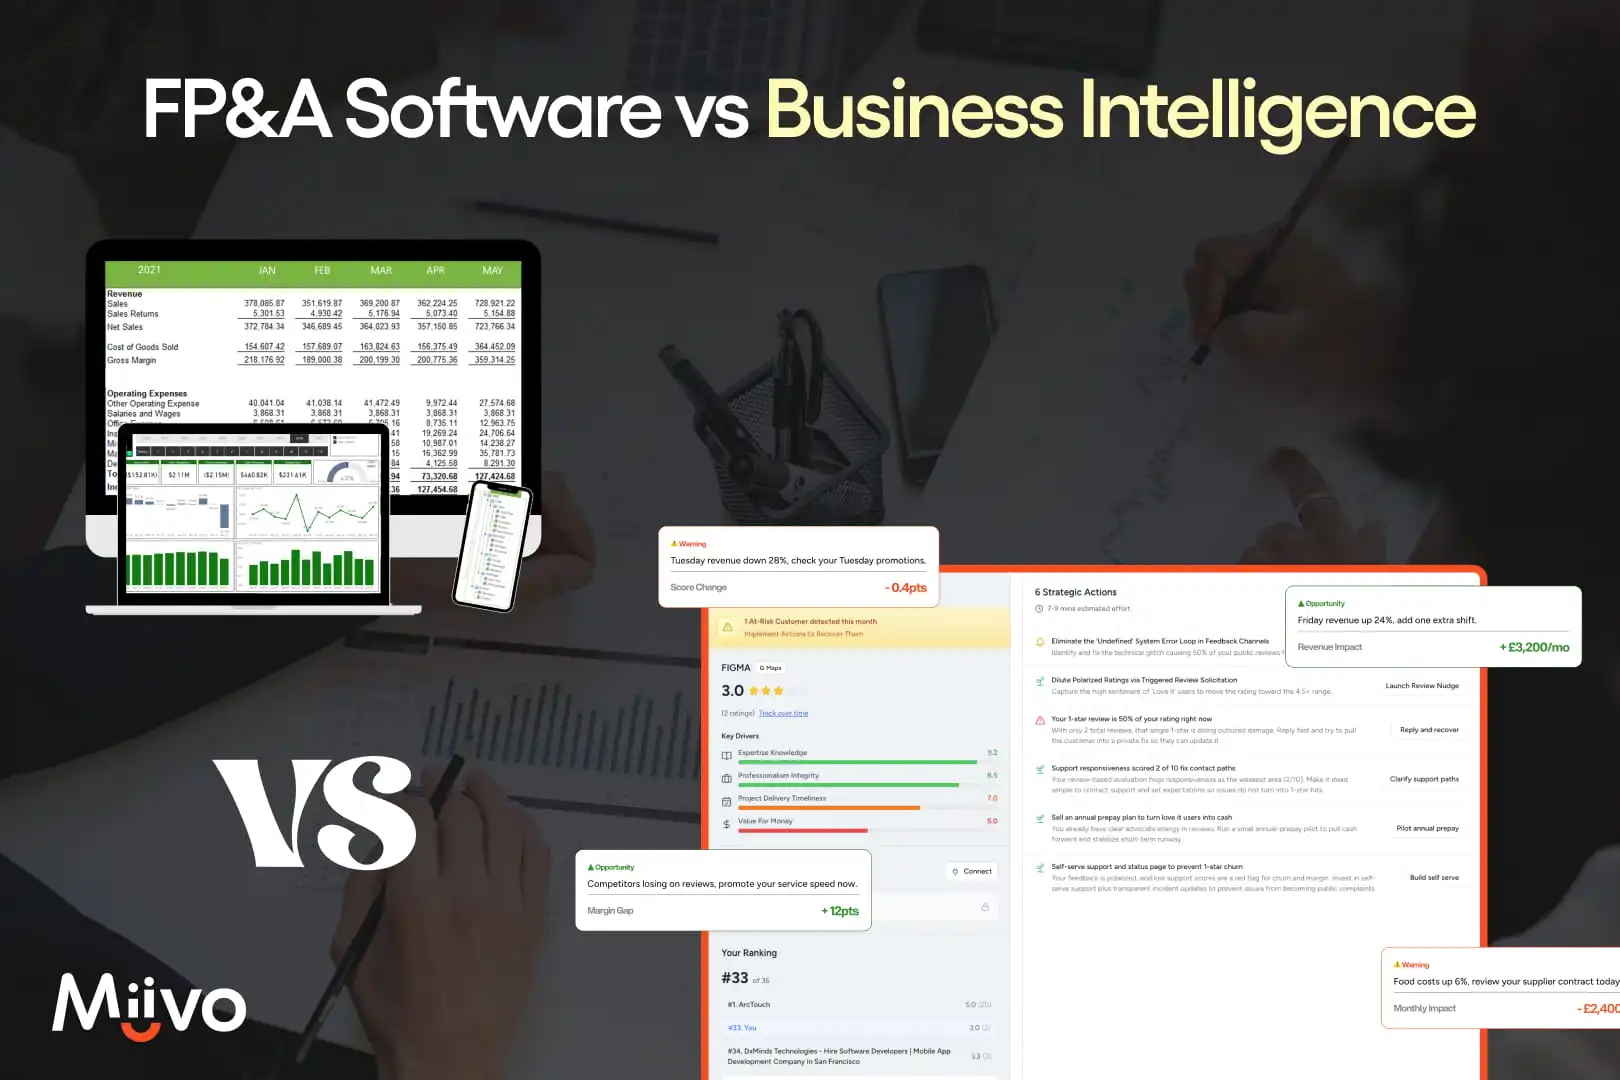
    Financial Planning and Analysis software helps finance teams plan, budget, forecast, and model different financial scenarios. It is forward-looking, the primary question FP&A answers is not ‘what happened’ but ‘what will happen if we do X.’ Examples include Anaplan, Planful, Workday Adaptive Planning, Oracle Hyperion, and Mosaic. These are tools built for CFOs, financial analysts, and finance managers, not for a business owner without a finance background. 

    FP&A helps finance teams with the following.

    • Budgeting: building and managing formal annual budgets by department and entity.
    • Forecasting: creating rolling financial forecasts that update as conditions change.
    • Scenario modeling: running what-if analyses to see how different decisions would affect the business financially.

    What Kind of Business Actually Needs FP&A Software?

    FP&A software makes sense for a business that has at least one dedicated finance person and has outgrown spreadsheets for budgeting and forecasting. Most commonly, this means mid-market companies with a finance team, a CFO, or a controller who needs to build multi-year financial models and collaborate on budget approvals across departments. For most companies under $5 million in revenue without a finance team, FP&A software is more tool than is needed.

    What Is Business Intelligence Software and Who Is It Built For?

    Business intelligence software connects to the data sources a business already has, its POS, accounting software, and review platforms, and presents what is happening in the business right now and historically. BI is the rearview mirror and the speedometer, it tells you where you have been and how fast you are going. Examples include Power BI, Tableau, Zoho Analytics, and Miivo. Unlike FP&A software, BI is useful for business owners, managers, and operators at almost any size.
    BI software provides the following benefits.

    • Dashboards: a live view of key numbers from across the business in one place.
    • Reporting: automated summaries of sales, costs, and performance by period.
    • Alerts: automatic flags when something moves outside its normal range, before a problem grows.

    What Kind of Business Needs Business Intelligence Software?

    BI software fits a much wider range of businesses than FP&A. If you are a business owner who wants to see revenue, costs, and customer data in one place, without needing a finance team to interpret it for you, BI is the category you are looking for. This is especially true for physical businesses like restaurants, retail shops, salons, and gyms, where operational data from the POS and bookings matters as much as financial data from the accounts.

    How Do FP&A Software and Business Intelligence Compare?

    Here is how the two categories compare across the dimensions that matter most for a business owner trying to decide.

    FP&A SoftwareBusiness Intelligence
    Primary question it answersWhat will happen?What is happening now?
    Time orientationForward-lookingBackward and present
    Who uses itFinance teams, CFOs, analystsBusiness owners, managers, operators
    What it requiresFinance expertise to build and maintainWorks for anyone, without finance background
    Setup time2 weeks to 18 monthsDays to weeks
    Best for business sizeMid-market and enterprise with finance teamsAny size
    What it does bestBudgeting, forecasting, scenario modelingDashboards, reporting, alerts
    Example toolsAnaplan, Planful, Workday AdaptivePower BI, Tableau, Zoho, Miivo

    Which One Does Your Business Actually Need?

    Different tools are suitable for different types of business. Evaluate your business to understand your required software, as discussed below.

    1. You are a small business owner with no finance team and want to see your sales, costs, and customer data in one place.

    You need business intelligence, not FP&A. A BI tool connects to your existing data sources and shows you what is happening without requiring finance expertise to set up or maintain. For physical businesses specifically, Miivo connects financial and operational data automatically, so you see your full business picture without building or managing anything yourself.

    1. You run a growing business with a finance person on staff and need to build formal budgets, run financial forecasts, and model different scenarios.

    You likely need FP&A software. Tools like Planful or Mosaic are built for exactly this. If your team is already getting value from BI dashboards, many companies use both BI and FP&A together.

    1. You are mostly using Excel and feel like you have outgrown it, but are not sure which direction to go.

    Start with BI, get visibility into what is currently happening before investing in a tool that plans for the future. Understanding your current performance is the foundation that makes financial planning possible.

    1. You have been pitched an FP&A tool and are not sure if you need it.

    Ask yourself one question: do you have a finance team that will use it? If the answer is no, the answer is probably BI for now. FP&A without a finance team to operate it is just an expensive dashboard.

    Running a Physical Business and Looking for BI?

    Book a 15-minute call. We will show you how Miivo connects your financial and operational data into one automatic view, before you commit to anything.

    [Book a 15-minute call]

    *No credit card. No commitment. See your data first.
    Frequenly Asks Questions

    What is FP&A software and who is it built for?

    Financial Planning and Analysis (FP&A) software helps finance teams plan, budget, forecast, and model financial scenarios. It is forward-looking, focused on what will happen rather than what has happened. Examples include Anaplan, Planful, Workday Adaptive Planning, Oracle Hyperion, and Mosaic. These tools are built for CFOs, financial analysts, and finance managers, not for a business owner without a finance background.

    What kind of business actually needs FP&A software?

    FP&A software makes sense for a business that has at least one dedicated finance person and has outgrown spreadsheets for budgeting and forecasting. It is most useful for mid-market companies with a finance team, a CFO, or a controller who needs to build multi-year financial models and collaborate on budget approvals across departments. For most companies under $5 million in revenue without a finance team, FP&A software is more than they need.

    What is business intelligence software and who is it built for?

    Business intelligence (BI) software connects to the data sources a business already has, such as its POS, accounting software, and review platforms, and shows what is happening in the business right now and historically. Examples include Power BI, Tableau, Zoho Analytics, and Miivo. Unlike FP&A software, BI is useful for business owners, managers, and operators at almost any size.

    What kind of business needs business intelligence software?

    BI software fits a much wider range of businesses than FP&A. It suits business owners who want to see revenue, costs, and customer data in one place without needing a finance team to interpret it, especially physical businesses like restaurants, retail shops, salons, and gyms, where operational data from the POS and bookings matters as much as financial data from the accounts.

    How do FP&A software and business intelligence compare?

    FP&A software answers what will happen, is forward-looking, and is used mainly by finance teams, requiring finance expertise and a setup time of two weeks to eighteen months; it best suits mid-market and enterprise businesses with finance teams. BI software answers what is happening now, is backward and present looking, works for anyone without a finance background, takes days to weeks to set up, and fits businesses of any size.

    Which one does your business actually need, FP&A or BI?

    A small business owner with no finance team who wants to see sales, costs, and customer data in one place needs BI, not FP&A. A growing business with a finance person who needs to build formal budgets and run forecasts likely needs FP&A software. A business that has outgrown Excel but is not sure which direction to go should start with BI to understand current performance before investing in a tool that plans for the future.

  • Why Do Food and Beverage Businesses Stop Growing at 3 Locations?

    Why Do Food and Beverage Businesses Stop Growing at 3 Locations?

    Your F&B business is thriving in a location, so you open location 2, and something feels off. The numbers are there, but the margin is not what it was at location 1. Then you open location 3, but now you are working harder than you ever have and somehow making less. Most F&B operators hit a scaling wall between location 3 and location 4. The food is not the problem, the management model is. You are fielding problems from three different sites, none of them fully visible from where you are sitting. Per-location cost differences, fragmented data, and owner-dependent operations combine to make growth feel impossible. Every experienced F&B operator recognizes this moment. Owners who break through build systems that give them a clear view of what each location actually earns. This post explains what causes it and what the operators who get past it actually do.

    Is the Problem With Scaling About the Food or the Business?

    F&B operators rarely struggle to scale because the food or service got worse. They struggle because the management model that worked at one location, which consists of the owner personally overseeing every hire, every supplier invoice, every night’s performance, cannot stretch across three sites simultaneously. The same hands-on involvement that built the first location becomes the bottleneck that stops the fourth from opening. This is not a leadership failure. It is a systems problem in a business that has not yet built systems.

    Why Does Location 2 Feel Less Profitable Than Location 1?

    Two identical restaurant concepts at different sites produce completely different margins. Not because of the menu or the service, but because of variables the owner cannot see without looking at each site separately.

    Location 1: Rent at 8%, labor at 28%, food cost at 30%. Margin: 32%.
    Location 2: Rent at 12%, labor at 32%, food cost at 33%. Margin: 20%.

    According to VantaInsight’s restaurant food cost percentage, food cost at a well-run independent restaurant runs between 28 and 35% of revenue, and labor cost at a full-service restaurant usually runs between 30 and 35% of revenue. When rent, labor, and food cost are each 2-4% points higher at a second site, the combined impact on margin can be 8-12% points. The National Restaurant Association’s 2024 State of the Restaurant Industry reports that restaurant profit margins already average just 2 to 10% depending on format and size. A 10-point margin gap between two locations is not a rounding error. It is the difference between a business that grows and one that stalls.

    The concept is identical. The economics are not. And without per-location financial data, the owner cannot see which variable is causing the gap.

    What Happens to a Restaurant Group When There Is No Single Data View?

    When each location holds its own data, the group picture comes together from emailed spreadsheets that reflect last week, not today.

    • Cost problems arrive late: A food cost issue that started at the beginning of the month is only discovered when finance reconciles invoices at month-end, 30 days after it began.
    • Ordering decisions have no group view: A manager at location 2 ordering stock has no way to know that location 3 is overstocked with the same item.
    • Price increases pass through undetected: When a supplier raises prices, the increase runs through receiving for weeks before anyone notices the gap between budget and actual invoice total.

    These are not technology problems. They are the direct result of data stuck inside each location, with no single view across the group. By the time the numbers reach the owner, the month is already over.

    Why Do the Things That Worked at Location 1 Stop Working at Location 2?

    In a single restaurant, the owner is the system. They carry the scheduling logic in their head. They know which supplier gives the best price. They know when the prep team is cutting corners. When a second location opens, none of that knowledge transfers automatically. The manager at location 2 builds their own version from scratch. Some things work, some do not. Without standardized metrics across both sites, the owner cannot even compare the two approaches to see which one is producing better results. Recipe adherence drifts, labor scheduling varies. The best practices from location 1 stay at location 1, undocumented and unrepeatable.

    What Do F&B Operators Who Scale Past 3 Locations Actually Do Differently?

    The operators who break through share three things in common.

    • They can see each location separately: Not a combined total, but a per-location view of margin, food cost, and labor, updated frequently enough to act on. This lets them identify which location is underperforming and why, within days, not weeks or months.
    • They transfer what works: Once the best-performing location’s practices are visible as data points, they can be named, documented, and replicated. The best margin at site one does not stay at site one.
    • They expand with something to go on: Before signing a lease for location 4, they understand their unit economics, what each location actually earns on its own, clearly enough to forecast whether it will be profitable. Expansion is planned, not hoped for. According to Gilkey Restaurant Consulting’s 2026 guide on scaling multi-unit F&B businesses, understanding unit economics is the prerequisite for confident expansion decisions.

    These are not sophisticated strategies. They are the basic conditions for informed decision-making. The operators who stall are no less capable. They simply do not yet have the visibility to act on what is happening across their group in time.

    What Does Financial Visibility Look Like for an Independent Restaurant Group?

    The F&B business owners who break through the 3-location wall are not necessarily the ones who built elaborate dashboards or hired data analysts. They are the ones who, at any point in the week, can answer three questions

    • Which of my locations had the best margin this week?
    • Where is a cost moving in the wrong direction? 
    • What would I need to know before I felt confident opening another site? 

    Miivo’s AI Business Dashboard is built to answer those three questions for physical small businesses, automatically, without the owner having to pull data from each location manually.

    What is the 3-location wall in restaurant multi-unit growth?

    The 3-location wall is the point at which complexity outgrows the owner’s capacity to manage through direct oversight. Revenue continues to grow, but margin shrinks, because food cost, labor, and rent vary across sites in ways that are invisible without per-location financial data.

    How Does a Business Dashboard Help a Multi-Location F&B Business?

    A business dashboard centralizes data from POS systems, accounting platforms, CRMs, and payroll tools into a single, real-time view. Instead of manually exporting spreadsheets across locations, F&B business operators compare performance instantly, spot underperforming sites before problems compound, and act on live data instead of last week’s numbers. Operational intelligence is the approach, and a dashboard is where you actually see it across all locations.

    Which KPIs Should a Restaurant Group Track Across Locations?

    The most critical KPIs a restaurant group should track across locations fall into three categories. Sales performance includes revenue per location, average order value, table turnover rate. Cost control consists of food cost percentage (ideally 28–35%), labor cost (typically around 30% of revenue), prime cost (ideally at or below 60% of sales), and guest metrics like Net Promoter Score, repeat visit rate, and revenue per diner. Knowing which specific KPIs to track across locations that matter most for a small F&B business is critical to growth.

    When Does Gut Feeling Stop Being Enough for a Growing Restaurant?

    Gut feeling stops being enough the moment a second location opens because no business owner can be everywhere at once. Restaurant net profit margins average just 3–5%, so small inefficiencies compound fast. Research shows 68% of restaurant chains still rely on intuition for key operational decisions, which means the operators who move to data-driven dashboards gain a measurable edge. Successful business owners know how to combine gut instinct with data-driven decisions as the business grows.

    Frequently Asks Questions

    What is the 3-location wall in restaurant multi-unit growth?

    The 3-location wall is the point at which complexity outgrows the owner’s capacity to manage through direct oversight. Revenue continues to grow, but margin shrinks, because food cost, labor, and rent vary across sites in ways that are invisible without per-location financial data.

    How does a business dashboard help a multi-location F&B business?

    A business dashboard centralizes data from POS systems, accounting platforms, CRMs, and payroll tools into a single, real-time view. Instead of manually exporting spreadsheets across locations, F&B business operators compare performance instantly, spot underperforming sites before problems compound, and act on live data instead of last week’s numbers.

    Which KPIs should a restaurant group track across locations?

    The most critical KPIs a restaurant group should track across locations fall into three categories. Sales performance includes revenue per location, average order value, and table turnover rate. Cost control consists of food cost percentage, labor cost, and prime cost. Guest metrics include Net Promoter Score, repeat visit rate, and revenue per diner.

    When does gut feeling stop being enough for a growing restaurant?

    Gut feeling stops being enough the moment a second location opens, because no business owner can be everywhere at once. Restaurant profit margins are thin, so small inefficiencies compound fast, and operators who move to data-driven dashboards gain a measurable edge over those relying on intuition alone.

    What is unit economics, and why does it matter before opening a new location?

    Unit economics is what a single location actually earns on its own, once its own rent, labor, and food cost are accounted for separately from the rest of the group. Operators who understand their unit economics can forecast whether a new site will be profitable before signing a lease, turning expansion into a planned decision instead of a hopeful one.

  • Best Small Business Analytics Platforms in 2026

    Best Small Business Analytics Platforms in 2026

    If you have searched for analytics tools recently, you have probably seen the same two categories of results. The first is web and marketing analytics: Google Analytics, Mixpanel, HubSpot. These track website visitors and marketing campaigns. The second is self-serve BI platforms: Zoho Analytics, Power BI, Looker Studio. These let you build your own dashboards from existing data. Both categories are genuinely useful for certain businesses. If you run a physical business, a restaurant, a salon, a gym, or a retail shop, most of those tools track the wrong things. This guide focuses on the analytics platforms that connect to the data a physical business actually generates: sales, operations, costs, and customer reviews. Not website clicks.

    This comparison reviews 7 platforms relevant to small physical businesses in 2026: Miivo, Zoho Analytics, Klipfolio, Databox, Looker Studio, Power BI, and Google Analytics 4. Each one is reviewed on what it actually is, who it is built for, what it does well, and what it does not do. A comparison table and a decision framework help you find the right fit for your situation.

    This comparison is written for independent business owners running one to five physical locations. Enterprise buyers and businesses with dedicated data teams will find more relevant options among platforms like Tableau, Sisense, or ThoughtSpot. This page does not review those tools in depth because they are not designed for an independent owner-operator with limited time and no IT staff.

    All 7 Platforms At A Glance

    Here is a quick overview before the full review of each platform below.

    PlatformWhat Type of AnalyticsBest ForBiggest LimitationStarting Price
    MiivoDone-for-you BI (financial, operational, reviews)Physical SMBs wanting automatic, combined data viewsNot a web or marketing analytics toolFree / $399/month
    Zoho AnalyticsSelf-serve BI and reportingSMBs comfortable building their own dashboardsSelf-serve only, limited native POS integrationFree / $30/month
    KlipfolioReal-time KPI dashboardsBusinesses wanting live dashboards from multiple toolsNo physical business native connectors, no human teamFrom $90/month
    DataboxMulti-source metrics dashboardConsolidating digital marketing and sales metricsPrimarily digital/marketing data, limited physical business fitFree / $47/month
    Looker StudioFree dashboard builder (Google ecosystem)Businesses using Google Analytics and Google AdsNot a BI platform, no POS or accounting connectionFree
    Power BIEnterprise BI (Microsoft)Organisations with a data engineer or IT staffRequires technical resource, setup cost is significant$10/user/month + setup
    Google Analytics 4Web analytics onlyAny business wanting to understand website visitorsTracks website data only, no POS, accounting, or operational dataFree

    Miivo: Business Intelligence for Physical Small Businesses, Done for You

    What Miivo Is

    Miivo is an AI-powered business intelligence service with a dedicated human team. In contrast to all the other platforms in this comparison, Miivo is done for you, which means the team connects your data sources, builds a combined dashboard, monitors the business, and highlights what needs attention automatically, without the owner configuring or interpreting anything.

    Best For

    Independent small physical businesses, such as restaurants, salons, gyms, and retail shops with one to five locations, that want to see their financial and operational data in one place, without building or maintaining anything themselves.

    What Miivo Does Well

    • Connects financial data from accounting, operational data from the POS, and customer review data from Google and other platforms into one automatic daily view.
    • AI Warning Signals flag problems before they grow.
    • Opportunity Cards surface specific actions the business can take.
    • A dedicated human team handles setup, maintenance, and interpretation throughout.
    • Goes live in 5 business days, with transparent pricing and no hidden setup costs.

    For a single-location restaurant, that 5-day window covers connecting the POS and the accounting file. The owner does not touch a dashboard builder at any point in the process.

    What Miivo Does Not Do

    • Miivo is not a web analytics or marketing analytics platform. It does not track website traffic or campaign performance. 
    • Not built for digital-only businesses or businesses with internal data teams wanting custom reports. 
    • Does not replace a POS or accounting software.

    Pricing: Ready to Use for free, Built for You at $399/month. Managed Services at $1,299/month. Setup included. No hardware costs.

    See how Miivo works for small physical businesses

    Zoho Analytics: Affordable Self-Serve BI for Small Businesses

    What Zoho Analytics Is

    Zoho Analytics is a self-service BI and reporting platform built for SMBs. It offers drag-and-drop dashboard creation, an AI assistant called Zia that responds to natural language queries, and more than 100 integrations. The business analytics platform gives small businesses a capable and affordable way to build reports from data they already collect.

    Best For

    Small businesses that are comfortable building and maintaining their own reports from clean, organized data. It suits teams that want a capable self-serve BI platform without a large upfront investment.

    What Zoho Analytics Does Well

    • Accessible entry price, including a free tier.
    • Drag-and-drop interface and Zia’s natural language queries, so basic setup requires minimal technical expertise.
    • Scales as the business grows and connects to a wide library of third-party tools. 

    What Zoho Analytics Does Not Do

    • Zoho Analytics is self-serve only, which means the owner builds and maintains everything. 
    • There is no human team, no automatic flagging of problems, and no proactive monitoring. 
    • Does not natively connect to POS systems or restaurant-specific platforms. 
    • Multi-location views require manual setup. 
    • Competitor monitoring and review tracking are not included.

    Pricing: Free plan (2 users, limited rows). Basic from $30/month. Standard from $60/month.

    Klipfolio: Real-Time KPI Dashboards From Multiple Data Sources

    What Klipfolio Is

    Klipfolio is a cloud-based KPI dashboard tool that connects to more than 1,000 data sources and displays live metrics across business functions. The analytics platform is built for businesses that want real-time visibility across multiple tools in one place.

    Best For

    Small businesses that want real-time dashboards pulling from multiple existing tools, like accounting, marketing, and sales, and have someone available to configure and maintain the setup.

    What Klipfolio Does Well

    • Offers an extensive connector library and live dashboards that update as data changes.
    • Flexible visualization options, practical for displaying metrics on shared team screens.
    • Standard setup does not require SQL knowledge, and the interface is accessible for non-technical users working with supported data sources.

    What Klipfolio Does Not Do

    • Klipfolio is self-serve, so setup and ongoing maintenance fall to the owner or a team member. 
    • Does not connect natively to POS or hospitality-specific platforms. 
    • There is no human team to interpret data.
    • No automatic AI flagging.
    • No proactive monitoring built specifically for physical SMBs.

    Pricing: Basic from $90/month. Professional from $225/month.

    Databox: All-in-One Metrics Dashboard for Marketing and Operations

    What Databox Is

    Databox is a dashboard platform that aggregates metrics from multiple tools into mobile-ready dashboards. The analytics platform focuses on KPI tracking and goal monitoring, with more than 100 one-click integrations targeting digital marketing and sales data sources.

    Best For

    Small businesses and marketing teams that want to consolidate metrics from several existing digital tools, such as HubSpot, Shopify, Google Ads, and QuickBooks, into one view.

    What Databox Does Well

    • One-click integrations, goal tracking, mobile dashboards, and period-over-period comparisons.
    • Free tier makes it accessible for businesses starting out.
    • Works well for consolidating marketing and sales metric tracking across digital channels.

    What Databox Does Not Do

    • Primarily built for digital and marketing metrics. 
    • Limited native integration with POS systems or physical business data sources. 
    • Self-serve configuration is required. 
    • No human team for interpretation and no proactive flagging beyond basic threshold alerts.

    Pricing: Free plan (3 data sources). Starter from $47/month. Professional from $135/month.

    Looker Studio (now Data Studio): A Free Tool for Building Your Own Reports

    What Looker Studio Is

    Google Looker Studio (now Data Studio) is a free dashboarding tool that connects strongly to Google products, such as GA4, Google Ads, Search Console, and Sheets, along with more than 1,000 community connectors. The reporting tool produces shareable, visual reports from data the user supplies.

    Best For

    Businesses that use Google Analytics or Google Ads and want a free reporting layer with someone willing to build and maintain their own reports.

    What Looker Studio Does Well

    • Core product is completely free.
    • Dashboards are easy to share with stakeholders.
    • Integration with the Google ecosystem is strong, and basic use does not require technical knowledge.
    • Works well for website traffic and marketing campaign reporting.

    What Looker Studio Does Not Do

    • Looker Studio is not a business intelligence platform for physical businesses. 
    • No native connection to POS or accounting software. Connecting those data sources requires third-party connectors that often carry additional costs. 
    • No automatic alerts.
    • No multi-location views without manual builds per site.
    • No team or interpretation support.

    Pricing: Free. Pro at $9/user/month. Third-party connector costs vary.

    Power BI: The Most Capable Platform on This List, If You Have the Technical Resource

    What Power BI Is

    Power BI is Microsoft’s enterprise BI and analytics platform and offers industry-leading analytical capability once set up correctly. According to the latest industry data, it is used by 97% of Fortune 500 companies. The BI platform operates within the Microsoft 365 ecosystem and connects to hundreds of data sources.

    Best For

    Mid-to-large organizations with a data engineering team or IT department, or businesses already deep in the Microsoft 365 ecosystem with someone technical on staff.

    What Power BI Does Well

    • Extremely powerful when configured correctly.
    • Deep integration with Microsoft 365, Excel, and Azure.
    • Real-time data with Direct Lake.
    • Strong governance and security controls.
    • Hundreds of connectors support a wide range of data sources for businesses with the internal resources to build and maintain models.

    What Power BI Does Not Do

    • Requires a data engineer or technically skilled person to build and maintain data models. Most independent small business owners cannot do this themselves. 
    • Connecting POS or hospitality data requires custom development work. 
    • The apparent low subscription price hides significant engineering time costs that make the real investment substantially higher.

    Pricing: Power BI Pro at $10/user/month. Data engineering cost additional and significant.

    Google Analytics 4: Website Analytics, Not Business Analytics

    What GA4 Is

    Google Analytics 4 tracks website visitor behavior, traffic sources, and online conversions. It is web analytics, not business intelligence for a physical business.

    Best For

    Any business with a website that wants to understand where visitors come from and what they do on the site.

    What GA4 Does Well

    • Free and the most widely used web analytics platform. 
    • Integrates strongly with Google Ads.
    • Machine learning identifies trends automatically.

    What GA4 Does Not Do

    • No connection to POS systems, booking platforms, accounting software, or physical location data. 

    A restaurant can use GA4 to track website visitors but not in-store revenue, covers, or margins.

    Pricing: Free.

    How All 7 Platforms Compare Side by Side

    Here is how all 7 platforms compare across the features that matter most for a physical small business.

    FeatureMiivoZoho AnalyticsKlipfolioDataboxLooker StudioPower BIGA4
    Financial data and P&LYes ✅ (via accounting)Partial ⭕Partial ⭕Partial ⭕No ❌Partial ⭕ (if built)No ❌
    POS integration for physical businessesYes ✅ (50+ systems)Partial ⭕Partial ⭕Partial ⭕No ❌No ❌No ❌
    Review and reputation trackingYes ✅No ❌No ❌No ❌No ❌No ❌No ❌
    Done-for-you setup and human teamYes ✅No ❌No ❌No ❌No ❌No ❌No ❌
    AI automatic alerts and flaggingYes ✅ (Warning Signals)Partial ⭕ (Zia queries only)No ❌Partial ⭕ (basic alerts)No ❌Partial ⭕Partial ⭕ (anomaly detection)
    Website and marketing analyticsNoPartial ⭕Partial ⭕Yes ✅No ❌No ❌Yes ✅
    Physical business without data teamYes ✅Partial ⭕Partial ⭕Partial ⭕Yes ✅ (limited)No ❌Yes ✅ (limited)
    Entry pricingFree / $399/monthFree / $30/monthFrom $90/monthFree / $47/monthFree$10/user/month + setupFree

    Which Analytics Platform Fits Your Business

    Small businesses are of various types and require a distinct business analytics platform that perfectly fits their needs. Carefully analyze your business needs first to pick the platform most suitable for your business.

    You run a physical business and want to see your financial and operational data automatically, without building anything: Miivo is the only done-for-you option among the best small business analytics platforms that connects physical business data, including POS, accounting, and reviews, into one automatic daily view. It is the right fit when the main gap is visibility without setup effort. No dashboard to configure, no integrations to maintain.

    You are comfortable building your own dashboards and want an affordable self-serve platform: Zoho Analytics is a strong self-serve option at this price point. The wide integration library, drag-and-drop interface, and AI assistant make it accessible without technical expertise. Expect to invest time in the initial setup and ongoing maintenance.

    You just want to consolidate metrics from several existing digital tools into one live dashboard: Klipfolio and Databox both handle this well. Klipfolio has a larger connector library and performs better for real-time KPI displays across team screens. Databox is more affordable at entry level and offers stronger goal tracking for businesses focused on sales and marketing metrics.

    You have a website and primarily want to understand your online visitors and marketing campaigns: Google Analytics 4 is free and the most capable web analytics platform available. Pair it with Looker Studio for free custom reporting when you need to control how the data is presented.

    You have a data person or IT staff and are already in the Microsoft ecosystem: Power BI is the most capable analytics platform on this list once fully configured. The investment in data engineering time pays off when the business has the internal resources to build and maintain models over time. 

    FAQs

    What is the difference between web analytics and business intelligence for a physical business?

    Web analytics tools such as GA4 track website visitors and campaigns. Business intelligence platforms such as Miivo, Zoho Analytics, and Power BI connect to POS, accounting, and operational data, the systems a restaurant, salon, gym, or retail shop actually runs on.

    Do these platforms connect to POS systems?

    Miivo connects to more than 50 POS systems. Zoho Analytics, Klipfolio, and Databox offer partial or third-party POS connections. Looker Studio, Power BI, and GA4 have no native POS connection.

    Which platform requires the least setup work?

    Miivo is done for you, which means that the team builds the dashboard and it goes live within 5 business days. Looker Studio and GA4 are free but require the owner to build reports. Zoho Analytics, Klipfolio, and Databox are self-serve, so setup time depends on how many data sources are connected.

    Is Power BI a good fit for a single-location small business?

    Power BI is built for organizations with a data engineer or IT department. For a single-location small business without a technical resource, the setup and engineering cost is the main barrier, not the $10 per user subscription itself.

    What does a done-for-you platform like Miivo cost compared to self-serve tools?

    Miivo’s paid plan starts at $399 per month. Self-serve tools range from free (Looker Studio, GA4, and the free tiers of Zoho Analytics and Databox) to $90/month and up (Klipfolio). The self-serve options cost less upfront but require the owner’s time and cost to build and maintain.

    See What Your Business Data Looks Like Inside Miivo

    Book a 15-minute call. We will pull your business data and show you what it looks like inside Miivo before you commit to anything.

    [Book a 15-minute call]

    *No credit card required. No commitment. See your data first.

  • Best Business Intelligence Tools for Restaurant Owners in 2026

    Best Business Intelligence Tools for Restaurant Owners in 2026

    Restaurant margins in 2026 average 2-10%. Yet most restaurant owners make daily staffing, pricing, and promotion decisions based on incomplete information, because the data is scattered across a POS, an accounting tool, and a review platform that do not talk to each other. Business intelligence tools exist to solve this. The problem is knowing which tool is actually right for a business like yours.

    This comparison covers 7 tools that appear regularly when restaurant owners search for BI software: Miivo, Toast, Tenzo, Restaurant365, Square for Restaurants, SpotOn, and MarginEdge. Each is reviewed on what it actually is, who it is genuinely built for, what it does well, and what it cannot do. A feature comparison table and a decision framework at the end help you shortlist the right option for your specific situation.

    This comparison focuses on independent restaurants and small groups of 1 to 5 locations. Enterprise tools like Oracle Simphony and Avero are acknowledged but not reviewed in depth because their pricing and implementation complexity are generally unsuitable for an independent operator. If you run 20 or more locations, start with those platforms instead.

    Here Is What All 7 Tools Do, Quickly

    Here is a quick overview before the full review of each tool below.

    ToolWhat It IsBest ForBiggest LimitationStarting Price
    MiivoAI-powered BI platform with a dedicated human teamIndependent owners and small groups (1 to 5 locations) wanting clarity without a data analystNo standalone inventory or labor scheduling modulesFree; “Built for you” from $399/month
    ToastCloud POS with embedded analyticsSmall to mid-sized restaurants wanting an all-in-one POSOnly reads Toast’s own dataFrom ~$165/month per location
    TenzoDedicated restaurant BI and demand forecastingMulti-site operators with an existing tech stackRequires existing tools to feed data; self-serve onlyCustom (not published)
    Restaurant365Accounting, operations, and BI in one platformMulti-location restaurants with a finance teamComplex to set up; needs accounting capacity$400 to $1,500+/month
    SquareFree POS with basic reportingBudget-conscious cafes, food trucks, single sitesReads Square transactions onlyFree; Plus from $60/month
    SpotOnPOS and payments with embedded reportingSmall to medium independents wanting fast daily decisionsOnly sees SpotOn dataCustom (not published)
    MarginEdgeFood cost control and invoice automationFull-service restaurants tightening food costFood cost and operations only$330 to $500/month per location

    Miivo: Business Intelligence Plus a Team That Runs It for You

    What Miivo Is

    Miivo is an AI-powered business intelligence platform with a dedicated human consultant team. Unlike every other tool in this comparison, Miivo is done for you. The team connects all your data sources, builds your dashboard, monitors the business, and flags what needs attention, without the owner having to configure or interpret anything.

    Best For

    Independent restaurant owners and small groups of 1 to 5 locations who want financial and operational clarity without a dedicated data analyst. Miivo is particularly strong when your main gap is seeing the full picture and having someone flag what matters.

    What Miivo Does Well

    • Miivo combines financial data from accounting software, operational data from the POS, and customer review data in one automatic daily view. 
    • AI Warning Signals flag issues before they become expensive. 
    • Opportunity Cards surface specific actions without the owner going looking. 
    • Competitor monitoring is built in. 
    • A dedicated human team handles setup, maintenance, and interpretation. 
    • You go live in 5 business days. 
    • Two pricing tiers keep monthly costs transparent.

    What Miivo Does Not Do

    • Miivo is not ideal for a restaurant with an internal data team that wants to build custom reports themselves. 
    • It does not include standalone inventory management or labor scheduling modules.

    Pricing: Ready To Use free version requires no credit card, Built For You at $399/month. Managed Services at $1,299/month. Setup included. No hardware costs.

    Toast: POS with Built-In Reporting

    What Toast Is

    Toast is a cloud-based POS system with embedded analytics. It is not a standalone BI platform. The analytics are built into the POS subscription and only read data that flows through Toast’s own system.

    Best For

    Small to mid-sized restaurants, which make up 63% of Toast’s user base on G2, wanting an all-in-one POS with basic built-in reporting. Toast is the most widely used restaurant POS in the US.

    What Toast Does Well

    • Toast provides real-time dashboards for sales, labor, and menu performance directly from POS data. 
    • It benchmarks your restaurant against similar ones. 
    • The hardware is strong and the interface is intuitive for staff. 
    • Toast is good for understanding what is selling and when, within the Toast ecosystem.

    What Toast Does Not Do

    • Toast analytics only reads Toast data. 
    • There is no connection to accounting software, Google reviews, delivery apps outside Toast’s own ordering, or any external system. 
    • There is no full P&L view. 
    • There is no team for you to interpret the data.

    Pricing: Starter from $0/month. Core POS from approximately $165/month per location plus hardware.

    Tenzo: Restaurant BI for Multi-Site Operators

    What Tenzo Is

    Tenzo is a dedicated restaurant BI and demand forecasting platform. It is not a POS. Tenzo connects to 70 or more existing systems, including POS, labor, inventory, and review platforms, and centralizes that data into one dashboard.

    Best For

    Multi-site operators with 2 or more locations who already run a tech stack and want unified KPI dashboards with AI demand forecasting. Tenzo delivers the best value when several integrated tools already feed data in.

    What Tenzo Does Well

    • Tenzo offers 70+ integrations and cross-location benchmarking. 
    • Its AI demand forecasting uses historical sales, weather, and local events to predict demand. 
    • A custom dashboard builder lets operators configure deep, detailed reporting. 
    • Tenzo suits owners who want configurable data and the ability to build their own reports.

    What Tenzo Does Not Do

    • Tenzo requires existing tools to feed data in. 
    • It is fully self-serve, so the owner builds and interprets the dashboards. 
    • There is no human team. 
    • Custom pricing is positioned for multi-unit operators, which makes Tenzo expensive for a single independent location.

    Pricing: Custom. Not published. Typically mid to high hundreds per location.

    Restaurant365: Accounting, Operations, and Reporting in One Platform

    What Restaurant365 Is

    Restaurant365 is a comprehensive restaurant management platform that combines accounting, operations, and BI. It is a full back-office operating system, not just a reporting tool.

    Best For

    Full-service and multi-location restaurants with a finance team or controller who need deep financial control and back-of-house operations management.

    What Restaurant365 Does Well

    • Restaurant365 delivers deep financial insights, including real food cost, prime cost, and profit and loss by location. 
    • It includes full inventory management and labor tools, plus strong POS integrations. 
    • When configured properly, it becomes a genuine single source of truth for costs, sales, and operations.

    What Restaurant365 Does Not Do

    • Restaurant365 is complex to set up and manage without accounting experience. 
    • It overwhelms a single-location owner-operator. 
    • Pricing is high for small and medium-sized businesses. 
    • It offers no review tracking and no competitor monitoring. 
    • You need internal accounting capacity to extract full value.

    Pricing: Custom. Typically $400 to $1,500+ per month depending on locations and modules.

    Square for Restaurants: Free POS with Basic Reporting

    What Square Is

    Square for Restaurants is a POS system with built-in basic reporting, available on a free plan. The analytics cover Square transactions only.

    Best For

    Budget-conscious restaurants, cafes, and food trucks. Square users are 89% small businesses on G2. Square suits anyone starting out who needs a zero-cost entry point with basic sales visibility.

    What Square Does Well

    • Square offers a free plan and very easy setup, often same day. 
    • It covers basic sales metrics: revenue, top items, peak hours, and basic customer data. 
    • Square is a good starting point for a simple single-location operation.

    What Square Does Not Do

    • Square is restricted to Square transactions only. 
    • There is no P&L view, no accounting connection, no review tracking, and no delivery app analytics. 
    • As a BI tool, Square is an entry point, not a complete picture. 
    • There is no team support.

    Pricing: Free plan. Plus from $60/month. Premium from $165/month per location.

    SpotOn: POS and Operations Reporting for Independents

    What SpotOn Is

    SpotOn is a restaurant POS and payments company with embedded business intelligence reporting. It is primarily a POS with analytics, similar in structure to Toast.

    Best For

    Small to medium independent restaurants, which make up 61% of SpotOn’s user base on G2, wanting fast decisions from daily restaurant data without a separate BI stack.

    What SpotOn Does Well

    • SpotOn delivers restaurant operations intelligence aligned to POS and back-office workflows. 
    • It shows sales trends, menu insights, and labor visibility through curated integrations. 
    • According to SpotOn’s 2026 Outlook report, the company has moved to a no surprise fees pricing model.

    What SpotOn Does Not Do

    • SpotOn only sees SpotOn data. 
    • There is no accounting connection, no review tracking beyond basic, and no delivery app analytics outside SpotOn integrations. 
    • There is no analytics team for you.

    Pricing: Custom. Not publicly listed. Typically mid-market POS pricing range.

    MarginEdge: Food Cost Control and Invoice Automation

    What MarginEdge Is

    MarginEdge is a restaurant operations and food cost management platform. It focuses specifically on invoice processing, recipe costing, and cost of goods sold. It is not a general BI platform.

    Best For

    Full-service restaurants and bars that want to tighten food cost control and automate invoice processing above anything else.

    What MarginEdge Does Well

    • MarginEdge gives strong COGS visibility and automates invoice capture. 
    • It handles recipe costing and integrates with most major POS systems for sales versus cost comparison. 
    • On food cost, MarginEdge goes deeper than any general BI platform.

    What MarginEdge Does Not Do

    • MarginEdge has a narrow scope: food cost and operations only. 
    • There is no guest review tracking, no full financial P&L, no labor analytics, and no competitor monitoring. 
    • MarginEdge only does one specific job well.

    Pricing: Typically $330 to $500/month per location depending on plan.

    How All 7 Tools Compare Side by Side

    Here is how all 7 tools compare across the features that matter most.

    FeatureMiivoToastTenzoRestaurant365SquareSpotOnMarginEdge
    Financial data (P&L, profit margin)Yes ✅No ❌Partial ⭕Yes ✅No ❌No ❌No ❌
    POS integrationYes ✅ (50+)Yes ✅ (Toast only)Yes ✅ (70+)Yes ✅ (most major)Yes ✅ (Square only)Yes ✅ (own POS)Yes ✅ (most major)
    Customer review trackingYes ✅No ❌Partial ⭕No ❌No ❌No ❌No ❌
    Competitor monitoringYes ✅No ❌No ❌No ❌No ❌No ❌No ❌
    Done for you setup and human teamYes ✅No ❌No ❌No ❌No ❌No ❌No ❌
    AI-powered alerts and flaggingYes ✅Partial ⭕Yes ✅No ❌No ❌No ❌No ❌
    Transparent entry pricing$399/mo~$165/moCustomCustomFree / $60/moCustom$330+/mo

    Which Tool Fits Your Restaurant

    The following examples give an idea of different situations you can use a specific BI tool for your restaurant.

    1. You have no POS yet and need one with basic built-in reporting: Toast is the most widely used starting point. Choose Square if budget is tight and you need a free entry point. Neither gives a full business picture, but both cover the basics.
    2. You have a POS and want deeper reporting across multiple tools, and you are ready to build your own dashboards: Tenzo is the strongest dedicated BI option for 2 or more locations with an existing tech stack. It connects to 70+ systems. Expect to invest time in configuration.
    3. Food cost and invoice management are your primary pain: MarginEdge goes deeper on COGS, recipe costing, and automated invoicing than any general BI platform. If tightening food cost is your single most important gap, MarginEdge is the most focused option.
    4. You run 3 or more locations and have an internal finance team: Restaurant365 provides the deepest financial control: prime cost, real P&L by location, and full back-of-house operations. It requires accounting capacity internally, but it provides a genuine single source of truth when set up correctly.
    5. You want the full picture without building a tech stack yourself: Miivo is the only done for you option in this comparison. A dedicated team connects your POS, accounting, and reviews, builds your dashboard, and flags what needs attention, without you having to configure or interpret anything. Best for independent restaurants and small groups who need clarity, not another system to manage.

    Take a Look at Your Restaurant Data Inside Miivo

    Book a 15-minute call. We will pull your restaurant’s public data and show you what it looks like inside Miivo, so you can compare it against the other options with real numbers from your own business.

    [Book a 15-minute call] [Start for free]

    *No credit card. No commitment. See your data first.
    Frequently Asked Questions

    What is restaurant business intelligence software?

    Restaurant business intelligence software connects scattered operational data and turns it into clear, daily actions that improve your margins. It pulls from your POS, accounting tool, delivery apps, and review platforms into one view. Reporting tells you what happened, BI tells you what to do about it.

    What is the best BI tool for an independent restaurant?

    For an independent owner with 1 to 5 locations and no data analyst, Miivo is the strongest fit because a dedicated team sets it up and flags what matters for you. If you only need POS-level sales reporting, Toast or Square cover the basics at a lower entry price.

    How much do restaurant BI tools cost in 2026?

    Restaurant BI tools pricing ranges from free to $1,500+ per month. Square offers a free plan and paid tiers from $60/month. Toast core POS starts around $165/month per location. Miivo offers a free plan and charges flat $399/month for Built for You and $1,299/month for Managed Services. Tenzo, SpotOn, and Restaurant365 use custom pricing.

    Do I need a data analyst to use a BI tool?

    It depends on the tool. Tenzo and Restaurant365 expect you to build and interpret reports yourself, so internal capacity helps. Miivo is the only done for you option here, with a human team that handles setup, monitoring, and interpretation, so no analyst is required.

    Which restaurant BI tool tracks customer reviews and competitors?

    Miivo is the only tool in this comparison with built-in customer review tracking and competitor monitoring. Tenzo can pull review data through integrations. Toast, Restaurant365, Square, SpotOn, and MarginEdge do not track reviews or competitors.

    What is the difference between a POS analytics tool and a BI platform?

    A POS analytics tool, such as Toast, Square, or SpotOn, only reads data from its own system. A BI platform connects multiple sources, including accounting and reviews, into a single source of truth. POS analytics shows you what sold. A BI platform shows you the full financial and operational picture.

  • Best Business Intelligence Tools for Multi-Location Businesses in 2026

    Best Business Intelligence Tools for Multi-Location Businesses in 2026

    Running two or more locations is a different kind of problem than running one. Every location has its own data. The POS at site one does not talk to the POS at site two. The accounting software shows a combined number, not a per-location breakdown. At the end of the month, you are still manually adding things up to find out which location is actually making money. That is what business intelligence tools exist to fix.

    If you have searched for BI tools recently, you have probably seen the same list: Power BI, Tableau, Looker, and Sisense. These are all real tools used by real businesses, but they are built for organizations with data engineers, IT departments, and annual budgets that most small multi-location businesses do not have. This article compares 7 tools specifically through the lens of a business running 2 to 5 physical locations, not a 500-person corporation.

    The BI tools compared for multi-location businesses in 2026 are Miivo, Tenzo, Zoho Analytics, Power BI, Domo, Restaurant365, and Looker Studio. Each tool is reviewed on what it is, who it is genuinely built for, what it does well, and what it does not do. A decision framework at the end helps you identify which tool fits your situation.

    Here Is What All 7 Tools Do, At A Glance

    Here is a quick overview before the full review of each tool below.

    ToolWhat It IsBest ForBiggest LimitationStarting Price
    MiivoAI-powered BI service with a dedicated human team. Done for you.Independent owners running 2 to 5 physical locations who want a cross-location view without building a tech stackNot ideal for businesses with an internal data team who want custom reportsFree; Built for You plan at $399/month (setup included)
    TenzoDedicated hospitality BI platform with 70+ integrationsMulti-site restaurant and hospitality operators with an existing tech stackFully self-serve, no human team. Custom pricing typically high for small independentsCustom pricing
    Zoho AnalyticsAffordable self-serve BI for SMBsSmall business owners comfortable building their own reportsNo automatic flagging, multi-location setup is manualFree plan; Basic from $30/month
    Power BIEnterprise BI from MicrosoftMid-to-large organisations with a data engineering teamRequires a data engineer to build and maintain. Not for owner-operators without technical staff$10/user/month (setup cost additional)
    DomoCloud-based enterprise BI with strong mobile accessMedium to large organisations with a BI team needing executive dashboardsEnterprise pricing. Steep learning curve. Not designed for small multi-location businessesCustom annual quotes (Consumption-based pricing)
    Restaurant365Full back-office operating system for restaurant groupsMulti-location restaurant groups with an internal finance team or controllerComplex without accounting expertise. High pricing. Requires internal capacityCustom; typically starting from $400 to $1,500+/month
    Looker StudioGoogle’s free dashboarding toolBusinesses that want a free entry point and use Google products heavilyNot a full BI platform. Multi-location views built manually. No alerts or teamFree; Pro at $9/user/month

    Miivo: Business Intelligence Plus a Team That Runs It for You

    What Miivo Is

    Miivo is an AI-powered business intelligence service with a dedicated human team. Unlike every other tool in this comparison, Miivo is done for you: the team connects all locations’ data sources, builds a combined dashboard, monitors performance across sites, and flags what needs attention automatically, without the owner having to configure or interpret anything.

    Best For

    Business owners running 2 to 5 physical locations (restaurants, salons, gyms, retail) who want a cross-location view without building a tech stack. Particularly strong when the main gap is seeing which location is underperforming and having someone flag it before it becomes a bigger problem.

    What Miivo Does Well

    • Miivo combines financial data from accounting, operational data from each location’s POS, and customer review data into one automatic daily view per location. 
    • AI Warning Signals flag when one location moves outside its normal range. 
    • Opportunity Cards surface specific actions. 
    • Competitor monitoring is built in. 
    • A dedicated human team handles setup, maintenance, and interpretation. 
    • The service goes live in 5 business days, with two pricing tiers and transparent monthly pricing throughout.

    What Miivo Does Not Do

    • Miivo is not suitable for a business with an internal data team that wants to build and maintain its own custom reports. 
    • It does not include standalone inventory management or labor scheduling. 

    The business intelligence tool is built specifically for physical SMBs, not corporate groups with 50 or more locations.

    Pricing: Free Ready To Use plan, which requires no credit card. Built For You at $399 per month. Managed Services at $1,299 per month. Setup included. No hardware costs.

    See how Miivo works for multi-location businesses

    Tenzo: Multi-Location BI for Hospitality Operators

    What Tenzo Is

    Tenzo is a dedicated restaurant and hospitality BI platform, not a POS system. It centralizes multi-site operational and financial data from 70 or more connected sources into a single cross-location dashboard. It is purpose-built for hospitality, which makes it genuinely useful for restaurant and cafe groups and largely irrelevant for salons, gyms, or retail businesses.

    Best For

    Multi-site restaurant and hospitality operators running 2 or more locations who already have a POS, labor scheduler, and inventory tool feeding data into the system. Tenzo works best when there is already an established tech stack and someone on the team willing to build and manage dashboards.

    What Tenzo Does Well

    • The integration library covers 70 or more systems, including POS platforms, labor schedulers, and review aggregators. 
    • Cross-location benchmarking is built in from the start, not something the owner has to construct manually. 
    • AI demand forecasting uses historical sales data and local event calendars to project future covers and adjust staffing recommendations. 
    • The custom dashboard builder gives operators flexibility to track the KPIs that matter most to their specific operation.

    What Tenzo Does Not Do

    • Tenzo is fully self-serve. 
    • There is no human team to handle setup, ongoing maintenance, or interpretation. 
    • The owner builds and reads the dashboards themselves. 
    • Pricing is not published and is typically positioned for multi-unit operators, which makes the cost high for a small 2-location independent. 
    • Tenzo is hospitality-specific and is not a suitable option for salons, gyms, or retail shops.

    Pricing: Custom pricing. Not published.

    Zoho Analytics: Affordable Self-Serve Reporting for Small Businesses

    What Zoho Analytics Is

    Zoho Analytics is a self-service BI and reporting platform built for small and mid-sized businesses. It offers an accessible drag-and-drop interface, a wide library of connectors, and an AI assistant called Zia that responds to natural-language questions about your data. The entry price is among the lowest of any tool in this comparison.

    Best For

    Small business owners who are comfortable building their own reports and have clean, organized data already in place. Zoho Analytics suits businesses that want a low-cost, self-serve BI tool connecting to common SMB software like QuickBooks, Zoho CRM, or Google Sheets, and have someone willing to maintain the dashboards on an ongoing basis.

    What Zoho Analytics Does Well

    • Pricing is affordable, with a free plan available for up to two users. 
    • The integration library covers 500 or more connectors. 
    • The drag-and-drop report builder requires no coding knowledge. 
    • Zia, the AI assistant, answers data questions in plain language, which lowers the barrier for non-technical users. 

    For a business with organized data and a willing operator, Zoho Analytics produces capable, cost-effective reporting.

    What Zoho Analytics Does Not Do

    • Zoho Analytics provides no human team, no automatic flagging, and no interpretation. 
    • Multi-location reporting requires manual setup per site. 
    • POS integrations are not as native as those in Tenzo. 
    • There is no review tracking or competitor monitoring. 
    • If no one in the business has time to build and maintain dashboards, the tool will not be used effectively regardless of its features.

    Pricing: Free plan for up to 2 users. Basic plan starts from $30 per month, Standard from $60 per month.

    Power BI: The Most Powerful Tool If You Have a Data Team

    What Power BI Is

    Power BI is Microsoft’s enterprise BI and analytics platform. It is the dominant tool for large organizations and is currently used by 97% of Fortune 500 companies. It offers industry-leading data modeling, visualization, and governance capabilities, and integrates deeply with the Microsoft 365 ecosystem. It is technically available to any size of business, but using it well requires someone who can build and maintain the underlying data models.

    Best For

    Mid-to-large organizations with a data engineering team or IT department already in place. Power BI is the strongest option on this list for a business that already runs the Microsoft stack, has a technically capable person on staff, and needs a tool that scales to complex reporting requirements. It is not built for business owners who need to check cross-location performance without technical support.

    What Power BI Does Well

    • Once set up, Power BI is extremely powerful. It connects to hundreds of data sources and produces excellent interactive dashboards. 
    • Near-real-time updates are available through Direct Lake mode. 
    • Governance and security controls are strong, which matters for businesses handling sensitive financial data. 
    • Deep integration with Microsoft 365, Azure, and Excel means it fits naturally into organizations already using those tools.

    What Power BI Does Not Do

    • Building useful dashboards requires a data engineer or someone with significant technical knowledge. Most small multi-location owners cannot do this themselves. 
    • Connecting POS or hospitality-specific data sources requires custom work, and that work has a real ongoing maintenance cost. 
    • The tool is not the problem. The assumption it makes, that a capable technical person exists to run it, is the problem for most businesses in the 2 to 5 location range operating without an IT team.

    Pricing: Power BI Pro at $10 per user per month. Data engineering setup cost is additional and significant.

    Domo: Enterprise-Grade Dashboards at Enterprise Prices

    What Domo Is

    Domo is a cloud-based enterprise BI platform that aggregates data from multiple sources and delivers executive dashboards with strong mobile access. It is built for medium to large organizations that need a centralized data view across many systems, and it is known particularly for its mobile app and real-time data capabilities.

    Best For

    Medium to large-sized organizations with a dedicated BI team that need data from many systems combined into a single executive view. Domo works well for presenting data to boards and leadership teams, and for organizations where senior decision-makers need mobile access to dashboards on the go. The tool depends on the existence of a team to configure, maintain, and manage it.

    What Domo Does Well

    • Domo connects to a very wide range of data sources. 
    • Its mobile app is genuinely strong for executives checking dashboards away from a desk. 
    • AI-powered insights are built in. 
    • The partner network and active community provide support for complex configurations. 

    For a large organization with the budget and team to use it properly, Domo produces a capable, real-time view across an entire operation.

    What Domo Does Not Do

    • Enterprise pricing puts Domo out of reach for most small multi-location businesses. 
    • The learning curve is steep for self-configuration.
    • The platform requires dedicated setup time and ongoing management. A 3-location restaurant or salon group has no data team to run this. 
    • Cost and complexity are the two most consistent criticisms from smaller users, and both apply directly to this audience.

    Pricing: Custom enterprise quotes up to tens of thousands. Annual contract required.

    Restaurant365: Deep Financial Control for Restaurant Groups With a Finance Team

    What Restaurant365 Is

    Restaurant365 is a comprehensive restaurant management platform that combines accounting, operations, and BI into one system. It is not a standalone BI tool. It is a full back-office operating system covering financial reporting, inventory management, food cost tracking, and multi-location consolidation. The depth of financial reporting it provides is not matched by any other tool in this comparison for restaurant groups.

    Best For

    Multi-location restaurant groups with an internal finance team or controller who need consolidated financial control across sites. Restaurant365 suits operators who want real P&L per location, prime cost visibility, and back-of-house management in a single platform, and who have the internal accounting capacity to set it up and use it properly.

    What Restaurant365 Does Well

    • Per-location financial reporting is the core strength. 
    • Real P&L, prime cost, food cost, and inventory by location are all available within a single consolidated view. 
    • POS integrations are strong and broad. 
    • For a restaurant group with a controller on staff, Restaurant365 provides the most thorough financial picture available at this business size.

    What Restaurant365 Does Not Do

    • The platform is complex to set up and manage without accounting expertise. For an owner-operator without a finance team, it is overwhelming. 
    • Pricing is high relative to the other tools in this comparison. 
    • There is no review tracking or competitor monitoring. 
    • Restaurant365 provides the platform, but the business owner has to supply the internal capacity to run it.

    Pricing: Custom pricing. Typically $400 to $1,500 or more per month depending on locations and modules. Implementation fees additional.

    Looker Studio: A Free Starting Point for Basic Reporting

    What Looker Studio Is

    Looker Studio is Google’s free dashboarding tool, formerly known as Google Data Studio. It connects to Google products, including GA4, Google Ads, Google Sheets, and BigQuery, as well as 800 or more community connectors. It creates shareable, visually clean dashboards and requires no upfront cost.

    Best For

    Businesses that want a free entry point for reporting, use Google Analytics or Google Ads heavily, and have someone willing to build reports manually. Looker Studio is well-suited to tracking digital marketing performance, but it is not designed to operate as the primary analytics system for a physical multi-location business.

    What Looker Studio Does Well

    • The core product is completely free. 
    • Dashboards are easy to share with stakeholders and look clean without requiring design work. 
    • Integration with Google’s ecosystem is natural and reliable. 
    • For a business primarily interested in tracking website traffic or ad performance, it provides a functional and accessible starting point.

    What Looker Studio Does Not Do

    • Looker Studio is not a BI platform in the full sense. 
    • There is no data warehouse, no semantic layer, and no automated flagging. 
    • Connecting POS or accounting data requires custom connector work. 
    • Multi-location views need to be built manually for each site. 
    • There is no team, no interpretation, and no alerts. 
    • It is a good tool for tracking Google Ads. It is not a sufficient tool for managing the operational and financial performance of a multi-location physical business.

    Pricing: Free for the core product. Looker Studio Pro at $9 per user per month. Third-party connector costs vary.

    How All 7 Tools Compare Side by Side

    Here is how all 7 tools compare across the features that matter most.

    FeatureMiivoTenzoZoho AnalyticsPower BIDomoRestaurant365Looker Studio
    Per-location performance viewYes ✅Yes ✅Partial ⭕ (manual setup)Partial ⭕ (if built)Partial ⭕ (if built)Yes ✅No ❌
    Cross-location benchmarkingYes ✅Yes ✅No ❌Partial ⭕ (if built)Partial ⭕ (if built)Partial ⭕No ❌
    Financial data and P&LYes ✅Partial ⭕Partial ⭕Yes ✅ (if connected)Yes ✅ (if connected)Yes ✅No ❌
    POS integrationYes ✅ (50+ systems)Yes ✅ (70+ systems)Yes ✅ (some)Partial ⭕ (custom work)Yes ✅ (via connectors)Yes ✅No ❌
    Review and reputation trackingYes ✅Yes ✅ (via integrations)No ❌No ❌No ❌No ❌No ❌
    Done-for-you setup and teamYes ✅No ❌No ❌No ❌No ❌No ❌No ❌
    AI alerts and automatic flaggingYes ✅Yes ✅ (demand forecasting)Partial ⭕ (Zia queries)Partial ⭕ (some alerts)Yes ✅ (AI insights)No ❌No ❌
    Accessible without a data teamYes ✅Partial ⭕Yes ✅No ❌No ❌Partial ⭕ (R365)Yes ✅

    Which Tool Fits Your Business

    Different multi-location businesses require different distinct features in their business intelligence tool that perfectly fit them, as given below.

    • You run 2 to 5 physical locations and want a cross-location view without configuring it yourself: Miivo is the only done-for-you option on this list. The team connects your data sources, builds the cross-location dashboard, and flags what changes across sites automatically. You do not build anything or interpret anything. This fits restaurant groups, salon chains, gym operators, and retail shops where the owner has no spare time for tech setup.
    • You run 2 or more restaurant or hospitality locations and already have a POS, labor scheduler, and inventory tool: Tenzo can be a good option in this case. It connects to more than 70 systems and provides genuine cross-location benchmarking and AI demand forecasting. Be prepared to build and maintain dashboards yourself, and factor in custom pricing when evaluating total cost.
    • You want an affordable self-serve tool and are comfortable building your own reports: Zoho Analytics can be an accessible option at this price point. It will not flag things for you automatically, but if you have clean data and someone willing to build the views, it is capable and reasonably priced. The free plan covers two users, which is enough to test whether it fits your operation before committing to a paid tier.
    • You are a restaurant group with 5 or more locations and a finance team or controller on staff: Restaurant365 provides the deepest per-location financial control available at this size: real P&L, prime cost, food cost, and inventory by site. It requires accounting capacity internally to use properly, and the pricing is based on the depth of the platform.
    • You already use Microsoft 365 and have someone technical who can build and maintain dashboards: Power BI is a powerful tool on this list once it is set up. If you have a data person and the Microsoft stack already in place, it connects to almost anything and scales as the business grows. The $10 per user per month license cost is low. The real cost is the data engineering work required to make it useful.

    Take a Look at Your Locations Inside Miivo

    Book a 15-minute call. We will pull data from your locations and show you what a combined view looks like inside Miivo, before you commit to anything.

    [Book a 15-minute call]

    *No credit card. No commitment. See your data first.

    Do small businesses with 2 to 3 locations actually need a BI tool?

    Yes, at two or three locations, the manual work of reconciling separate data sources takes real time each week. A BI tool replaces that with a single view updated automatically. The question is not whether you need the data. It is whether you can afford to keep producing it by hand.

    Can I track multiple locations without a data team?

    Yes, you can track multiple locations without a data team if you choose a done-for-you service tool. Self-serve tools like Power BI and Domo assume a technical person builds and maintains the dashboards, which most owners running 2 to 5 locations do not have. A managed service like Miivo connects every location’s POS, accounting, and review data, builds one combined view per site, and flags changes automatically, so you read the results without configuring anything.

    What is the best business intelligence tool for a small multi-location business? 

    The best business intelligence tool for a small multi-location business depends on whether you have a technical team. Owners running 2 to 5 locations without an IT department get the most from a done-for-you service like Miivo, which connects your data sources, builds a cross-location dashboard, and flags performance changes automatically. Self-serve tools like Zoho Analytics work well if you have clean data and someone willing to build the reports manually.

    Frequently Asked Questions

    Do small businesses with 2 to 3 locations actually need a BI tool?

    Yes. At two or three locations, the manual work of reconciling separate data sources takes real time each week. A BI tool replaces that with a single view updated automatically. The question is not whether you need the data, it is whether you can afford to keep producing it by hand.

    Can I track multiple locations without a data team?

    Yes, if you choose a done-for-you service. Self-serve tools like Power BI and Domo assume a technical person builds and maintains the dashboards, which most owners running 2 to 5 locations do not have. A managed service like Miivo connects every location’s POS, accounting, and review data, builds one combined view per site, and flags changes automatically, so you read the results without configuring anything.

    What is the best business intelligence tool for a small multi-location business?

    It depends on whether you have a technical team. Owners running 2 to 5 locations without an IT department get the most from a done-for-you service like Miivo, which connects your data sources, builds a cross-location dashboard, and flags performance changes automatically. Self-serve tools like Zoho Analytics work well if you have clean data and someone willing to build the reports manually.

  • What Is Operational Intelligence: Definition, Benefits, and How It Works?

    What Is Operational Intelligence: Definition, Benefits, and How It Works?

    Most business reports tell you what happened last week, while operational intelligence (OI) tells you what is happening right now. OI collects event data from your tools, processes it as it arrives, and surfaces insights you can act on immediately, like a spike in food costs, a sudden drop in website orders, or a machine running hot, OI catches these as they occur. This article covers what OI is, how it differs from business intelligence, how a system like it works, and how small businesses can use it without an enterprise budget.

    At a glance

    • Definition: The continuous analysis of live business data to support in-the-moment decisions.
    • Primary goal: Detect and respond to operational events as they happen.
    • Key inputs: Streaming data from POS systems, sensors, apps, CRMs, websites, and logs.
    • Key outputs: Operational dashboards, alerts and notifications, automated workflows.
    • Best for: Any business that needs to act on current-state data instead of waiting for end-of-month reports.

    What is operational intelligence?

    Operational intelligence is the continuous analysis of live data to support immediate decision-making. The intelligence watches your business as it runs and turns raw event data into clear signals you can act on, flags problems instantly, and triggers alerts or automated actions. OI helps you fix issues while they are still small, not after they show up in next month’s reports.

    The OI system takes inputs from active software, hardware sensors, and transaction records. The outputs are automated actions, visual dashboards, and immediate alerts. Traditional manual reporting depends on a person pulling data, formatting it, and reacting days later. OI removes that delay. It runs continuously in the background and flags an issue the moment a number falls outside a normal range. Think of a restaurant kitchen. A monthly report might show that food costs rose 6% last month. An operational intelligence platform flags the same rise the day it starts, with a note to review supplier pricing, just in time to act.

    What is the difference between operational intelligence and business intelligence?

    Operational intelligence is the practice of analyzing data in real time, as it is created, so decisions and actions can happen immediately. It is sometimes called “intelligent operations” and grew out of an earlier term, “operational business intelligence,” still used in places to mean the same thing. In contrast, business intelligence analyzes historical data to support long term strategic decisions. Business intelligence is like a map: it tells you where you have been and helps you plan where to go next. Operational intelligence is like a speedometer: it tells you how fast you are going right now, so you can adjust immediately if something is wrong. Both approaches use data to guide business decisions, but they operate on different timelines and serve different purposes. 

    FeatureOperational IntelligenceBusiness Intelligence
    FocusPresent operations and immediate actionsPast performance and future strategy
    SpeedReal-time or near real-timeHistorical and periodic
    GoalFix active problems and seize instant opportunitiesIdentify long-term trends and plan budgets
    Data TypeStreaming data and live transactionsBatched data and data warehouses
    Primary UserFrontline workers and operations managersExecutives and business analysts

    How does an operational intelligence system work?

    An operational intelligence system follows a strict four-step process. It collects data, analyzes it, presents the findings, and triggers an action.

    Step 1: Collection

    Data collection happens through constant data integration. The system connects to active software and gathers streaming data as a customer makes a purchase, a machine logs a temperature, or a user submits a ticket. The system does not wait for a daily batch upload.

    Step 2: Analysis

    Real-time analysis relies on anomaly detection and predefined rules. The system compares incoming data against set standards and uses specific thresholds to determine if a metric is normal. AI handles this step, which can spot a pattern faster and more consistently than someone manually reviewing the same data.

    Step 3: Presentation

    The OI system presents data through live visual dashboards and targeted notifications. It provides complete observability into the active workflow and fires warning signals when anything needs immediate attention. It does not hide critical alerts inside dense spreadsheets.

    Step 4: Action

    Business owners or teams act on insights by following automated workflows or making immediate manual corrections. A system can pause a marketing campaign automatically if the click cost exceeds a strict limit. Alternatively, a manager can review an alert about long wait times and manually assign a new staff member to the floor.

    What data does operational intelligence use?

    Operational intelligence relies on varied data sources across the entire business environment. Gathering data from multiple endpoints creates a complete picture of active operations.

    The most common data sources include:

    • Point of Sale (POS) systems that record live transactions and sales volume.
    • Customer Relationship Management (CRM) software that logs active support tickets and customer interactions.
    • Inventory databases that track stock levels and supply chain movements.
    • Scheduling tools that monitor staff attendance and shift changes.
    • Hardware sensors and system logs that record machine performance and website uptime.

    What are the benefits of operational intelligence?

    The benefits of operational intelligence that come up again and again across different industries are early risk detection, improved data visibility, and faster and better decisions. 

    According to Dresner Advisory Services, 70% of organizations consider real-time data critical to their daily business operations. Real-time data prevents small issues from becoming expensive crises.

    The benefits of OI are given below.

    • Catches problems while they can still be fixed: If a problem is only visible in a report at the end of the month, it has already had a month to cause damage before anyone notices. Operational intelligence solves this by detecting risks early as it monitors data in real-time.
    • Breaks down disconnected data: Information scattered across separate systems is hard to act on. Bringing it together in real time means nothing important gets missed because it was sitting in the wrong place.
    • Leads to faster, more confident decisions: Acting on what is happening right now, instead of guessing or waiting for a report, removes most of the uncertainty from day to day decisions and leads to faster and better actions.

    What are real-world examples of operational intelligence?

    Real-time analytics apply to almost every industry. The specific metrics change, but the core process remains identical. Some real-world examples are as follows.

    Restaurants

    A restaurant OI system monitors the POS and the inventory database. It tracks ingredient usage against live orders. If the kitchen runs low on a specific item, the system automatically removes the dish from the digital menu. This prevents customer frustration and front-of-house confusion.

    Salons

    A salon dashboard tracks walk-in customers against scheduled appointments. If the wait time exceeds twenty minutes, the system flags a warning signal. The manager can immediately call in a standby stylist to handle the overflow.

    Retail

    A retail system analyzes foot traffic through door sensors and compares it to active checkout lines. If the system detects a surge in shoppers, it alerts backroom staff to open an additional register. This keeps checkout times short and improves customer satisfaction.

    Who has traditionally used operational intelligence?

    Large enterprises with complex infrastructure have historically driven the adoption of operational intelligence. They possess the resources to build custom integrations and hire specialized analysts.

    This approach has mostly been built for a few specific roles.

    • IT and operations teams: Monitoring servers and systems so an outage is caught within seconds, instead of being discovered by a customer first.
    • Customer service teams: Watching live call or chat volume so extra staff can be brought in before a queue gets out of control.
    • Manufacturing and logistics teams: Tracking machines and deliveries in real time to catch a fault or a delay while it can still be corrected.
    • Retailers: Tracking product demand, stock levels close to their expiry date, and staff allocation throughout the day, rather than at the end of a sales period.

    Some companies use a specialized platform or portal for this work, often staffed by a role such as an operational intelligence manager or analyst.

    How does operational intelligence compare to traditional reporting?

    Traditional reporting requires a manual process. An analyst downloads data from a CRM, exports numbers from an accounting tool, and builds a spreadsheet. This process takes hours. The resulting report is outdated the moment the analyst hits save.

    Operational intelligence is fully automated. The system connects directly to the POS, CRM, and accounting software and updates the numbers every minute. Traditional reporting tells a manager how much revenue a store lost last week. Operational intelligence tells the manager how to stop losing revenue right now.

    What are the challenges of operational intelligence?

    Implementing operational intelligence involves specific hurdles. Organizations must address data quality and system integration for real-time analytics. The following challenges come up consistently.

    • Balancing speed with accuracy: Checking data instantly is not very useful if the data turns out to be wrong, but checking it carefully enough to be confident takes time, the opposite of what real-time monitoring is meant to deliver. Operational intelligence systems must use strict data validation rules to maintain accuracy without causing delays.
    • Cost and complexity: Legacy systems require expensive sensors or logging systems, custom coding, and dedicated maintenance staff, which is exactly why it has stayed mostly inside larger organizations with a department to spare. Modern OI software systems are built to provide maximum benefits while being cost-efficient.

    Is operational intelligence only for large enterprises?

    Historically, only massive corporations could afford real-time analytics. This reality is changing rapidly as cloud computing and artificial intelligence reduce infrastructure costs.

    The Operational Intelligence Market was valued at $4.04 billion in 2025 and is projected to reach $10.92 billion by 2035, growing at a 10.44% CAGR (Market Research Future, 2024). This growth is driven largely by wider accessibility.

    Similarly, the broader real-time analytics market reached $1.1 billion in 2025 and will likely hit $7.54 billion by 2034, expanding at a 25.1% CAGR (Fortune Business Insights, 2024). The advanced analytics sector supports this trend, sitting at $75.89 billion in 2024 with projections to reach $305.42 billion by 2030 (Grand View Research, 2024).

    These numbers indicate a significant shift. Real-time data tools are moving from enterprise-only custom builds to affordable, plug-and-play software solutions. Small businesses can now access the same analytical power previously reserved for Fortune 500 companies.

    How does operational intelligence work for small businesses?

    Small businesses face the same operational problems as large enterprises. A local salon needs to optimize its staff scheduling just as much as a national retail chain. The need for real-time visibility does not disappear just because a company has fewer employees.

    Miivo’s AI Business Dashboard delivers enterprise-level operational intelligence to small and medium businesses. It provides real-time data integration from over 50 platforms without requiring custom code. You simply connect your existing software, and the system begins analyzing your operations immediately.

    The dashboard tracks your specific business metrics continuously. It surfaces an Opportunity Card when the data points to a revenue opportunity and flags a Warning Signal the moment a critical metric drops. This gives you the tools to act quickly and confidently without needing an IT team or a specialized platform to set any of it up.

    FAQs

    How does artificial intelligence (AI) improve operational intelligence?

    Artificial intelligence (AI) processes large data streams faster than human analysts. It identifies complex patterns, reduces false alarms, and automates routine responses. This makes real-time monitoring far more accurate and significantly cheaper to run.

    How does OI connect to a regular business dashboard?

    Operational intelligence is the approach, a dashboard is usually where you actually see it. OI adds live metrics that update as events happen, the two work together. Your business dashboard becomes a current-state view that flags problems while you can still fix them.

    Which numbers should a system like this actually monitor?

    Real-time monitoring is only useful if it is watching the right numbers, so first define what counts as a KPI and which ones matter most for the business. Track the numbers that shift fast and cost you money. Watch live sales, inventory levels, food or supply costs, website orders, and customer wait times. Add payment errors and support ticket volume. Streaming data from these sources gives you the operational visibility to act the same day.

  • KPIs for Small Businesses: What They Are and Which Ones Matter

    KPIs for Small Businesses: What They Are and Which Ones Matter

    A KPI, or key performance indicator, is a number directly linked to a specific business goal that tells you whether that part of your business is on track. This page covers what makes a number a KPI rather than a plain metric, the five main categories small businesses track, the four KPIs to start with, and how to choose the right ones for your situation.

    Every small business produces more numbers than any owner has time to read. Revenue, transactions, clicks, followers, reviews, refunds, and the list grows every time you add a new tool. Out of every number your business generates, only a small set is tied directly to a goal that matters right now. Those are your KPIs. Everything else is data.

    This page explains what separates a KPI from a plain metric, why that distinction saves time, and which KPIs small business owners actually need to track. By the end, you will know how to build a short, deliberate set of KPIs that reflect your actual goals, not a generic list copied from a larger business with a dedicated analytics team.

    What does a KPI mean for a small business?

    A KPI, or key performance indicator, is a measurable number that shows how well a small business is reaching a specific goal. The word “key” is doing real work in that definition. Not every number qualifies. A KPI must be related to a goal, tracked against a target, and meaningful enough that a change in the number would change a decision.

    Monthly revenue growth is a simple example. The number on its own tells you whether sales are moving in the right direction. Pair it with a target, like 10% growth over the previous month, and you now have a number that tells you whether you are winning or losing, not just what happened.

    A KPI without a target is closer to a plain metric. A plain metric tells you what is happening. A KPI tells you whether what is happening is good enough.

    What is the difference between a KPI and a business metric?

    Every KPI is a metric. Most metrics are not KPIs.

    A metric is any number your business can measure. A KPI is the small subset of metrics connected to a goal you are actively working toward.

    MetricKPI
    Number of visitors to your website this weekConversion rate, when the goal is more online sales
    Number of social media followersNumber of bookings from social media, when the goal is more reservations
    Total transactions this monthRepeat customer rate, when the goal is loyalty and retention

    The practical difference is focus. Tracking every metric your software reports gives you a long list of numbers to scroll past. Tracking KPIs gives you a short list of numbers to act on.

    Why are KPIs important for small businesses?

    Small businesses run on fewer hours and fewer staff than large ones. That makes focus more important. Business owners who ignore KPIs completely face major challenges.

    Track nothing, and you rely on gut feeling alone. Gut feeling works when you know every customer by name, but it misses slow-building problems, such as rising costs, falling retention, a supplier issue, until they reach the bank balance. Track everything your software reports, and you end up reviewing none of it, because a screen full of numbers is as good as no numbers at all.

    The importance of KPIs for small businesses comes down to a small, deliberate set of numbers you check every week or month, tied to the goals you are actually working on right now, that tells you far more than a comprehensive report you never open.

    Specific benefits include the following.

    • Early warning signals. A drop in cash flow or a rise in customer churn shows up in your KPIs weeks before it becomes a crisis.
    • Goal tracking. You can see whether you are ahead of, behind, or on pace with what you set out to achieve.
    • Data-driven decisions. Numbers replace guesses when deciding whether to hire, restock, run a promotion, or change pricing.
    • Focus. A short KPI list tells you where to spend the next hour of your day.
    • Benchmarking. Comparing your numbers against industry averages shows where your business is performing well and where it is falling behind.

    What are the main types of KPIs for small businesses?

    The main types of KPIs for small businesses fall into five groups, organized by the part of the business they measure. Most small businesses benefit from tracking at least one KPI from each group, though the right mix depends on the current stage and goals of the business.

    The main types are financial, sales and marketing, customer, operational, and HR and employee. Each group has its own set of specific KPIs.

    What are financial KPIs for a small business?

    Financial KPIs measure the money side of the business. They show whether the business is generating profit, managing costs, and maintaining the cash position to operate day to day. These KPIs are the most closely watched because they determine the business’s survival.

    Key financial KPIs for small businesses include the following.

    KPIWhat It MeasuresFormula
    Revenue growth rateHow fast total revenue is increasing((Current Period Revenue – Prior Period Revenue) / Prior Period Revenue) × 100
    Gross profit marginWhat percentage of revenue remains after direct costs((Revenue – Cost of Goods Sold) / Revenue) × 100
    Net profit marginWhat percentage of revenue remains after all expenses(Net Profit / Revenue) × 100
    Cash flowNet movement of money in and out of the businessCash Inflows – Cash Outflows over a set period
    Accounts receivable daysHow long it takes customers to pay invoices(Accounts Receivable / Annual Revenue) × 365
    Quick ratioAbility to cover short-term obligations without selling inventory(Cash + Receivables) / Current Liabilities
    Customer acquisition cost (CAC)What it costs to win one new customerTotal Marketing and Sales Spend / Number of New Customers Acquired

    What are sales and marketing KPIs for a small business?

    Sales and marketing KPIs measure how well the business attracts and converts new customers. They show whether your spending on marketing is turning into paying customers, or just depleting the budget.

    Key sales and marketing KPIs are the following:

    KPIWhat It Measures
    Conversion ratePercentage of visitors or leads who make a purchase
    Website trafficNumber of visitors arriving at your site
    Cost per leadWhat it costs to generate one new enquiry
    Customer acquisition cost (CAC)Total cost to acquire one new customer
    Average order valueMean spend per transaction
    Sales pipeline valueTotal value of deals currently in progress
    Win ratePercentage of proposals or quotes that result in a sale
    Lead response timeHow quickly the business follows up with a new enquiry

    Example: If your website receives 1,000 visitors in a month and 50 of them complete a purchase, your conversion rate is 5 percent (50 divided by 1,000, multiplied by 100).

    What are customer KPIs for a small business?

    Customer KPIs measure loyalty, satisfaction, and the long-term value of existing customers. According to research from the Harvard Business Review, finding a new customer costs upto 25% more than retaining the existing one, which makes this group of KPIs especially important for businesses with tight marketing budgets.

    Key customer KPIs include the following.

    KPIWhat It Measures
    Customer lifetime value (CLV or LTV)Total revenue a customer is expected to generate over their relationship with the business
    Customer retention ratePercentage of customers who return within a set period
    Churn ratePercentage of customers who stop buying within a set period
    Customer satisfaction score (CSAT)How satisfied customers are after a specific interaction
    Net promoter score (NPS)How likely customers are to recommend the business to others

    What are operational KPIs for a small business?

    Operational KPIs measure day-to-day efficiency. They show where cash is tied up in slow-moving stock, where fulfillment is breaking down, and where time or space is sitting idle.

    Key operational KPIs are as follows.

    KPIWhat It Measures
    Inventory turnoverHow many times stock is sold and replaced in a period
    On-time delivery ratePercentage of orders fulfilled by the promised date
    Order processing timeAverage time from order placement to dispatch
    Shopping cart abandonment ratePercentage of online shoppers who add items but do not complete the purchase

    What are HR and employee KPIs for a small business?

    HR and employee KPIs measure the stability and productivity of the team. For small businesses, one or two of these is enough. The point is to catch problems with staff retention and productivity before they affect the customer experience or the finances.

    Key HR KPIs are given below.

    KPIWhat It Measures
    Employee turnover ratePercentage of staff who leave in a given period
    Employee satisfactionHow engaged and satisfied employees are in their roles
    Revenue per employeeAverage revenue generated per team member

    What are the 4 main KPIs every small business should start with?

    There is no single official set of KPIs that every business must track. But for owners who are not sure where to begin, four KPIs cover the basics of survival and growth without overwhelming a small team.

    1. Revenue growth rate. This tells you whether the business is expanding, contracting, or standing still. It is the most fundamental measure of momentum.
    2. Gross profit margin. Revenue growth means little if margins are too thin to cover operating costs. Gross profit margin shows whether the core business model is viable.
    3. Cash flow. A profitable business can still fail if cash runs out before invoices are paid. Cash flow tells you whether you can pay your bills this week, not just this quarter.
    4. Customer retention rate. Acquiring new customers costs way more than retaining existing ones. Retention tells you whether the customers you win are staying, which directly affects both revenue growth and acquisition cost.

    Start with these four and add others once you have a consistent routine for reviewing them.

    What is the difference between leading and lagging KPIs?

    A leading KPI points forward, it measures something you can still act on before the outcome is decided. A lagging KPI points backward, and it records a result that is already settled.

    Take a small retail store. The number of new customer inquiries this week is a leading KPI. If that number drops, you can run a promotion, increase social media activity, or adjust your opening hours before the week ends. Revenue for last month is a lagging KPI. It confirms what already happened, and no action this week will change it.

    The practical difference is timing. Leading KPIs give you room to steer. Lagging KPIs confirm whether your steering worked.

    Leading KPILagging KPI
    Number of sales calls booked this weekRevenue closed last quarter
    Number of appointment slots filledAverage monthly revenue per client
    Website traffic this weekConversion rate last month

    Most small businesses need both. A few leading KPIs tell you what is coming and where to focus your attention. A few lagging KPIs confirm whether the actions you took actually moved the business forward.

    How many KPIs should a small business track?

    Most small businesses do best with four to six KPIs in total. A useful rule of thumb is the “5 plus or minus 2 rule,” which means aim for five KPIs and accept a range of three to seven depending on the complexity of your current goals.

    Tracking more than that creates problems. A wall of twenty numbers gets opened far less often than a focused list of five. When everything is labeled a KPI, nothing is, and the numbers become wallpaper.

    Start with three to four KPIs directly related to your current primary goal. If your goal this quarter is profitability, track gross profit margin, net profit margin, cash flow, and one operational KPI related to cost efficiency. Once those are part of a regular review routine, add more as the business grows and goals evolve.

    The question to ask before adding any KPI is simple: if this number changes, will it change what you do? If the answer is no, it does not belong on the list.

    How do you choose the right KPIs for your small business?

    To choose the right KPIs for your small business, start with a goal, not a list of available metrics. The process is straightforward.

    1. State a specific business goal for the current period.
    2. Identify the metrics that directly measure whether you are achieving that goal.
    3. Include at least one leading KPI and one lagging KPI so you can steer and confirm.
    4. Set a clear target and assign one person as the owner of each KPI.
    5. Set a review schedule, weekly for operational KPIs and monthly for financial ones, and stick to it.

    Before a metric earns a place on your dashboard, it should pass three filters. First, is it tied to a specific goal? A number without a goal is a habit, not a KPI. Second, can you measure it consistently? A number you can only check occasionally is hard to act on. Third, will it actually change what you do? If the number moving would not trigger a different decision, remove it. Setting realistic KPIs for a small local business starts with these filters, not with a longer list borrowed from a larger business in a different industry.

    How do you set KPI targets using the SMART framework?

    A KPI without a target is just a number to watch. The SMART framework turns a KPI into a goal you can clearly evaluate.

    • Specific: Name exactly what you are measuring.
    • Measurable: State the number you are aiming for.
    • Achievable: Set a target that stretches the business without being unrealistic.
    • Relevant: Confirm the KPI connects to a real business priority.
    • Time-bound: Set a clear deadline.

    For example, a vague goal like “improve customer retention” becomes a SMART KPI target when stated as “Increase customer retention rate by 5% over the next quarter.”

    How can a small business track and measure KPIs?

    A small business has three practical options to track and measure KPIs.

    Spreadsheets are the simplest starting point. They require no subscription, work for any KPI you can calculate manually, and are easy to share with a co-founder or accountant. The main limitation is that spreadsheets require manual data entry, which introduces errors and depends on someone updating the file consistently.

    Accounting and business software such as Xero or QuickBooks includes built-in reporting that calculates financial KPIs automatically from your transaction data. These tools cover the financial side well, but do not connect operational, customer, and marketing data in one place.

    KPI dashboards that pull data automatically solve the fragmentation problem. They connect multiple data sources and display KPIs in real time without manual entry. For financial and operational KPIs specifically, Miivo’s AI Business Dashboard connects existing business data and translates it into clear KPI readings that update automatically, so the numbers you review each week reflect what is actually happening in the business rather than what you remembered to enter.

    What is the best KPI software for a small business?

    Accounting software with built-in dashboards, business intelligence tools, and AI-powered platforms designed specifically for small and mid-market businesses are the best choices. The best KPI software performs meaningful functions for a small business.

    • Automatic data pulls remove the risk of manual entry errors and save time each reporting cycle.
    • Clear, simple dashboards make it easy for a busy owner to read the numbers in under a minute, not interpret a report.
    • Software that connects to your existing tools, like accounting system, POS, or CRM, is more useful than one that sits in isolation.
    • Most small businesses need a tool in the range of $20 to $90 per month.
    • Self-serve setup is crucial, as a tool that requires a consultant to configure is a barrier most small businesses cannot absorb.

    Miivo offers AI-powered business intelligence for small and mid-market owners who want an affordable platform that unifies financial and operational data without requiring a data analyst to interpret the output.

    What KPIs should different industries track?

    The right KPIs change by business type. The table below maps each industry to the KPIs that reflect its actual business model.

    IndustryTop KPIs to Track
    RetailSales growth rate, inventory turnover, average transaction value
    EcommerceConversion rate, cart abandonment rate, average order value
    SaaS and softwareMonthly recurring revenue (MRR), churn rate, customer lifetime value
    Services (clinics, legal, hospitality)Billable hours or utilization rate, client retention rate, revenue per client

    What common KPI mistakes should small businesses avoid?

    The common KPI mistakes a small business must avoid and what to do instead are given below.

    MistakeWhat to Do Instead
    Tracking too many KPIsStart with three to four and add only when you have a consistent review routine
    Choosing vanity metricsAsk whether the number, if it changed, would actually change a decision
    Copying another company’s dashboardBuild your KPI list from your own current goals, not from a competitor’s annual report
    Setting no targetEvery KPI needs a specific number to compare against, or it tells you nothing
    Not reviewing the numbersA KPI you never act on wastes the time it took to set up

    What is a KPI dashboard and how does it help a small business?

    A KPI dashboard is a single screen that shows your most important numbers in one place, updated on a regular schedule. Rather than opening three separate tools to check revenue, stock levels, and customer satisfaction scores, you see all of them at once.

    Everyone on the team sees the same numbers, which removes the disagreements that come from different people looking at different reports. Problems show up faster because the numbers are visible daily, not discovered during a monthly review. And the review itself is quicker because the data is already gathered.

    For small businesses tracking financial and operational KPIs, Miivo’s AI Business Dashboard provides a ready-made dashboard that pulls in business data automatically and presents it as a clear, daily view of the numbers that matter most.

    FAQs about small business KPIs

    What does KPI stand for?

    KPI stands for key performance indicator. It is a number used to measure whether a business is making progress toward a specific goal.

    Are KPIs and metrics the same thing?

    No, KPIs and metrics are not the same thing. A metric is any number a business can measure. A KPI is one of the few metrics tied directly to a specific goal. Every KPI is a metric, but most metrics are not KPIs. The difference is purpose, a KPI exists to tell you whether you are winning, not just what is happening.

    How often should a small business review its KPIs?

    Operational KPIs such as cash flow and inventory turnover are best reviewed weekly. Strategic KPIs such as gross profit margin and customer retention rate are typically reviewed monthly. The right frequency is the one you will actually follow consistently.

    Can a small business track KPIs without special software?

    Yes, a small business can track KPIs without special software. A spreadsheet updated manually is a legitimate starting point and works well for businesses tracking three to five KPIs. The limitation is time and accuracy: manual entry requires discipline and introduces the possibility of errors. As the KPI list grows, affordable software like Miivo that pulls data automatically becomes more practical.

    FAQs About Small Business KPIs

    What does KPI stand for?

    KPI stands for key performance indicator. It is a number used to measure whether a business is making progress toward a specific goal.

    Are KPIs and metrics the same thing?

    No, KPIs and metrics are not the same thing. A metric is any number a business can measure. A KPI is one of the few metrics tied directly to a specific goal. Every KPI is a metric, but most metrics are not KPIs. The difference is purpose: a KPI exists to tell you whether you are winning, not just what is happening.

    How often should a small business review its KPIs?

    Operational KPIs such as cash flow and inventory turnover are best reviewed weekly. Strategic KPIs such as gross profit margin and customer retention rate are typically reviewed monthly. The right frequency is the one you will actually follow consistently.

    Can a small business track KPIs without special software?

    Yes, a small business can track KPIs without special software. A spreadsheet updated manually is a legitimate starting point and works well for businesses tracking three to five KPIs. The limitation is time and accuracy, since manual entry requires discipline and introduces the possibility of errors. As the KPI list grows, affordable software that pulls data automatically becomes more practical.